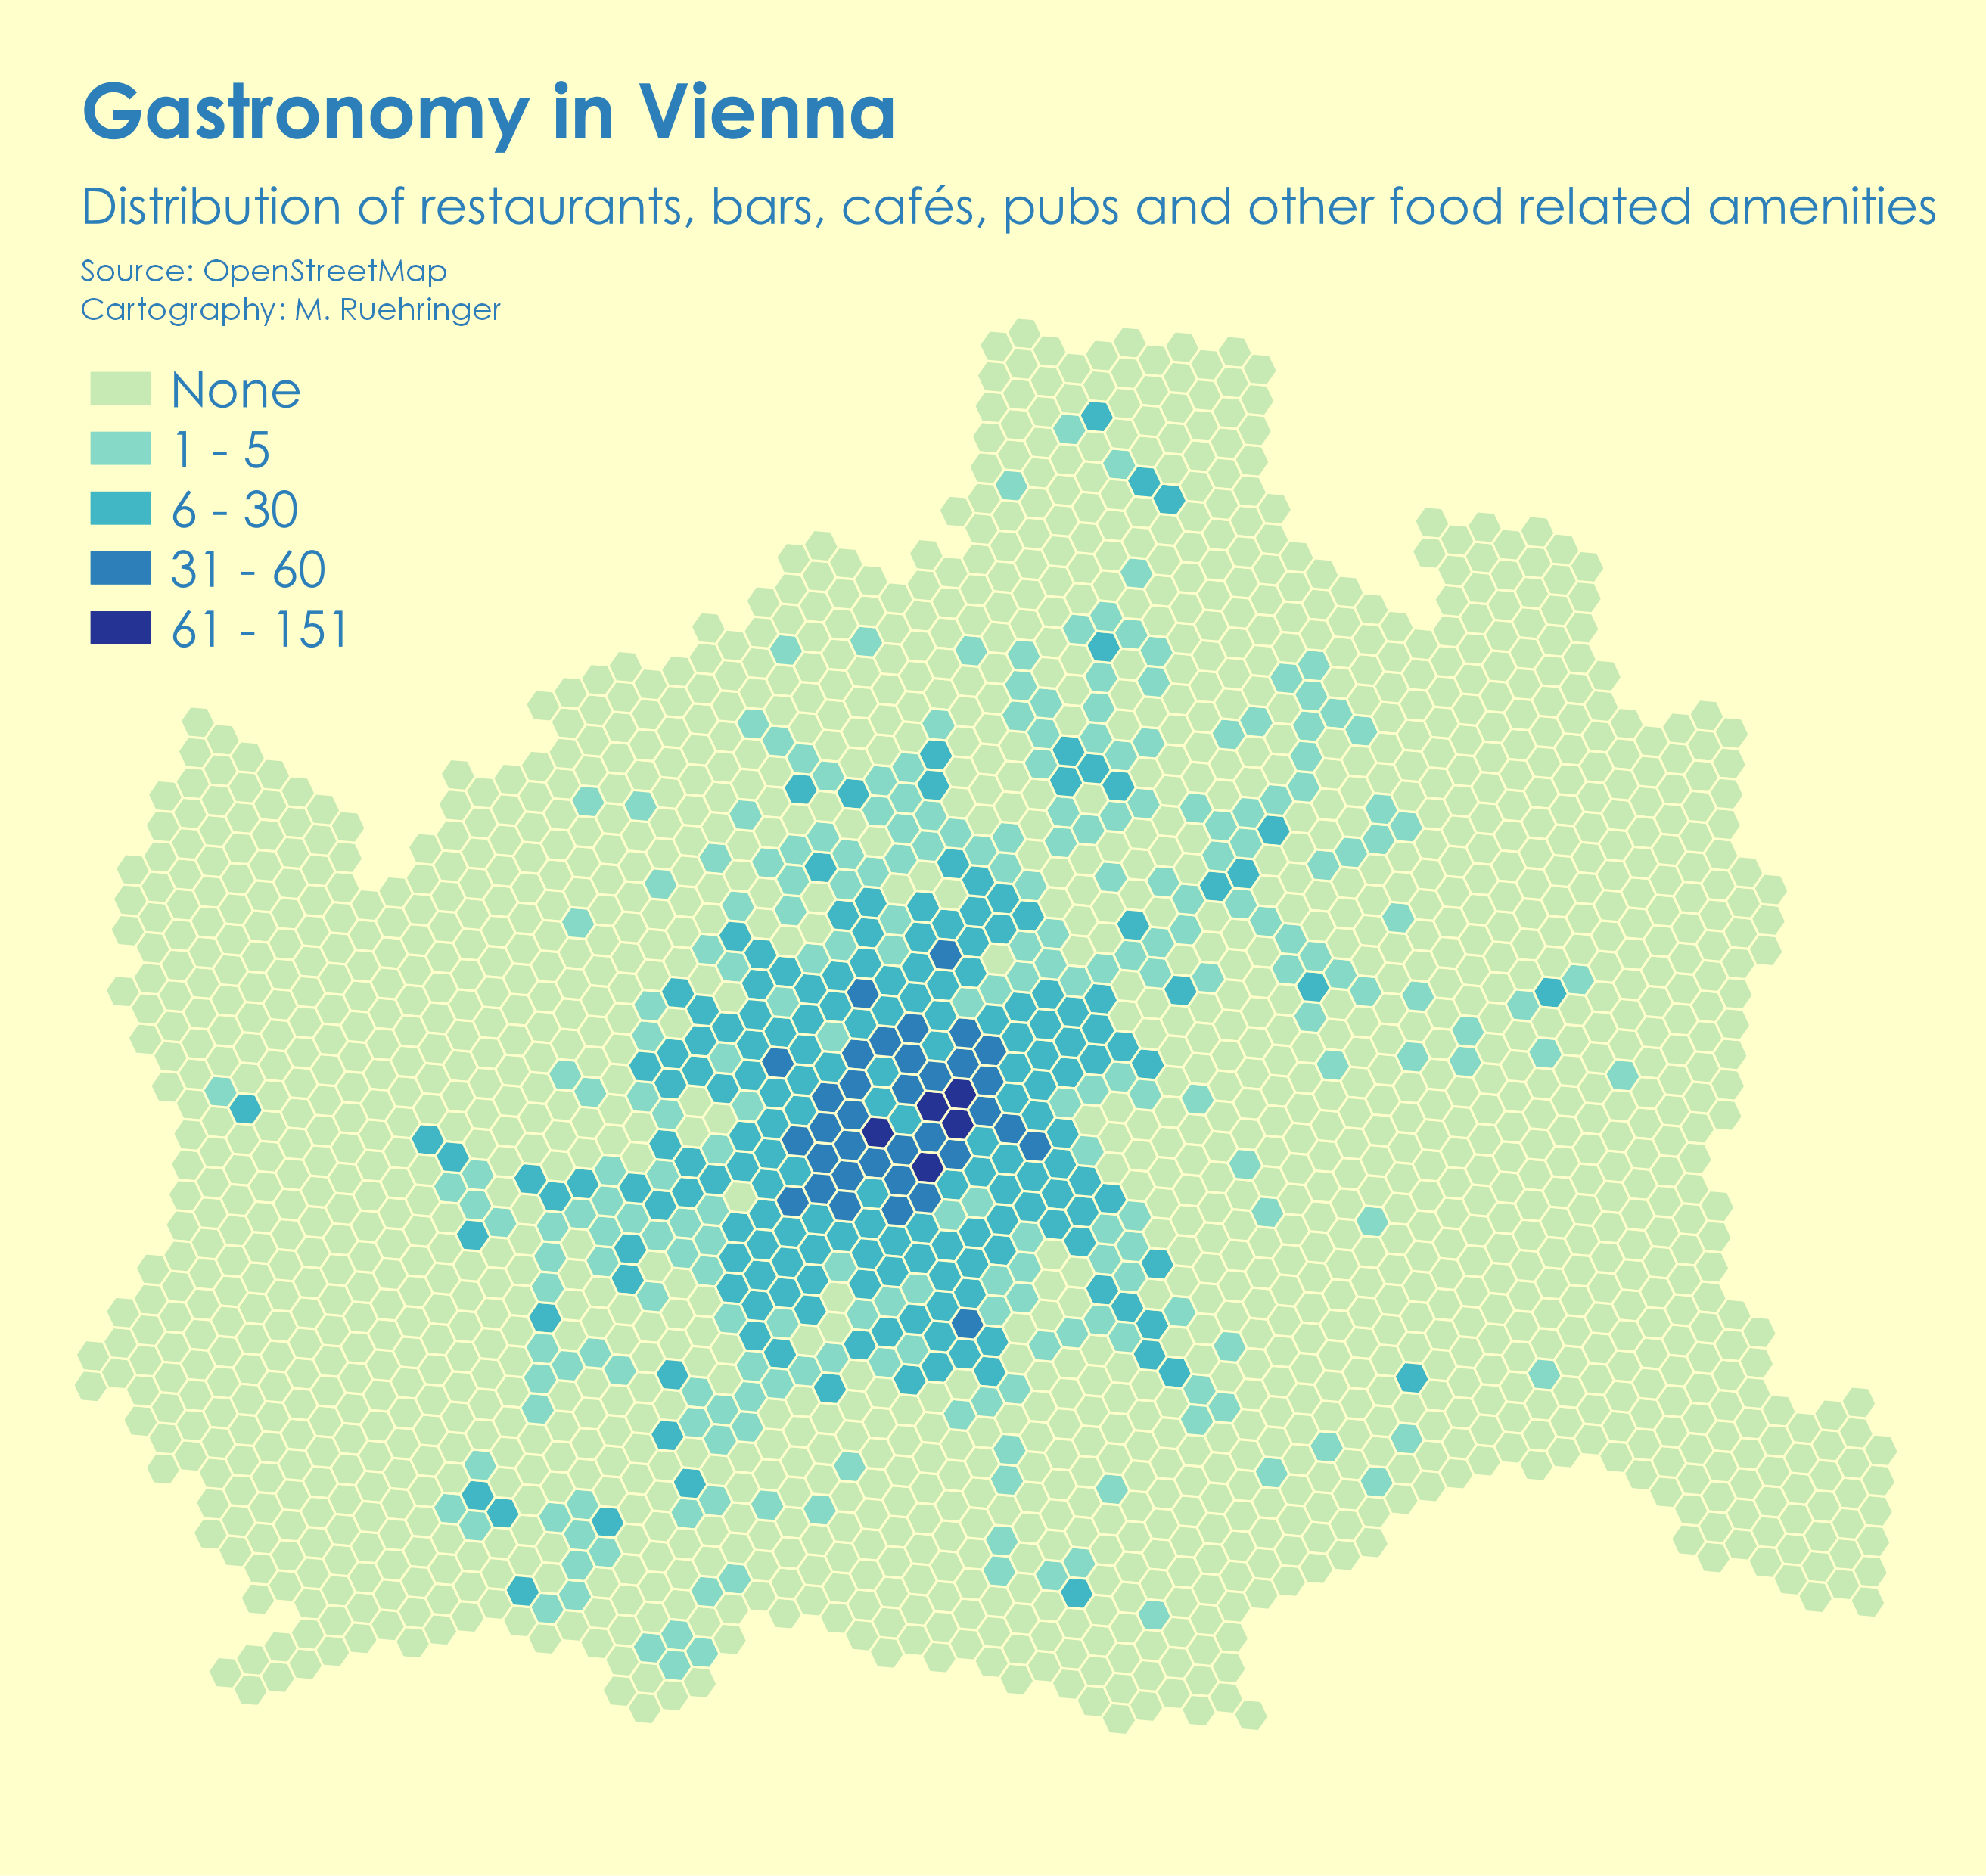
In this tutorial I will explain how to create a hexagon map in QGIS. We will be creating a map of bars, restaurants and cafes in Vienna in Austria. As data source we will be using open source data from OpenStreetMap.
Why hexagons?
Why make hexagon map? A main advantage is that they address the issue of different sizes of administrative units and that they integrate visually well with each other, as opposed to squares or triangles. When making calculations with hexagons, it is important to use an equal area projection. If you want to know more about the advantages and considerations of them, check out those two blog posts:
Let us start by getting the data. For this we will use the QuickOSM plugin, which allows you to quickly download OSM data directly into QGIS. The first step is to download the plugin via Plugins> Manage and Install Plugins.
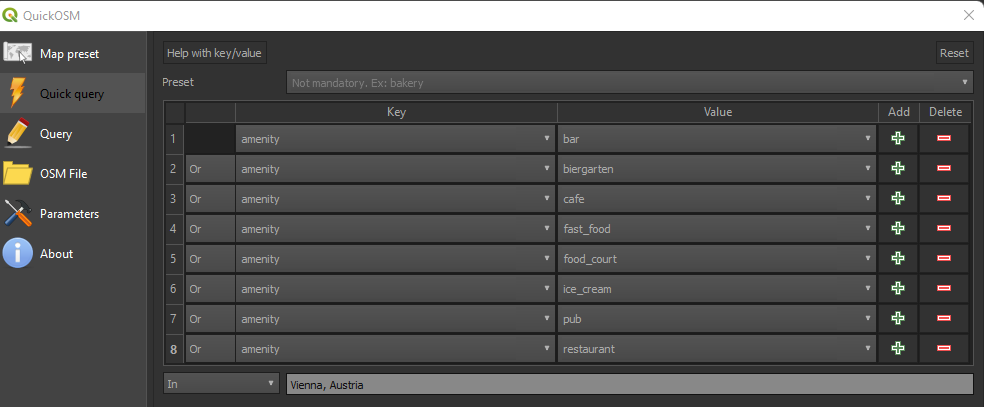
Now we can proceed by downloading the data. In QuickOSM you can specify the topic (e.g. land use, resturants) and region of the data you want to download. For this map we want get 2 types of data:
Point data: All gastronomy (bars, restaurants etc.) in Vienna, Austria
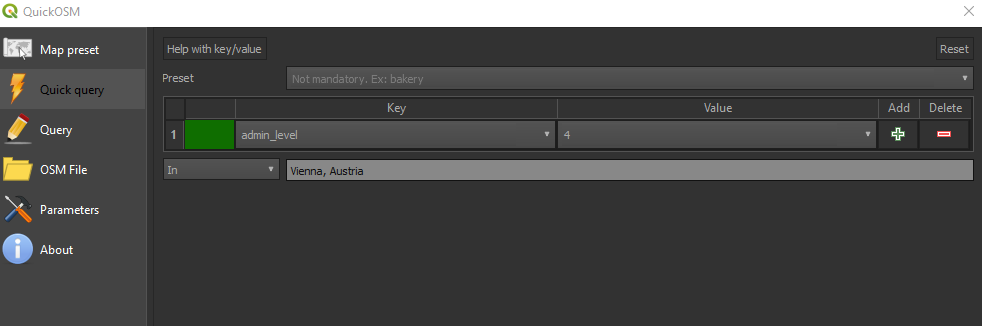
Administrative region of Vienna, Austria
To get those data, use the following settings and click Run query:
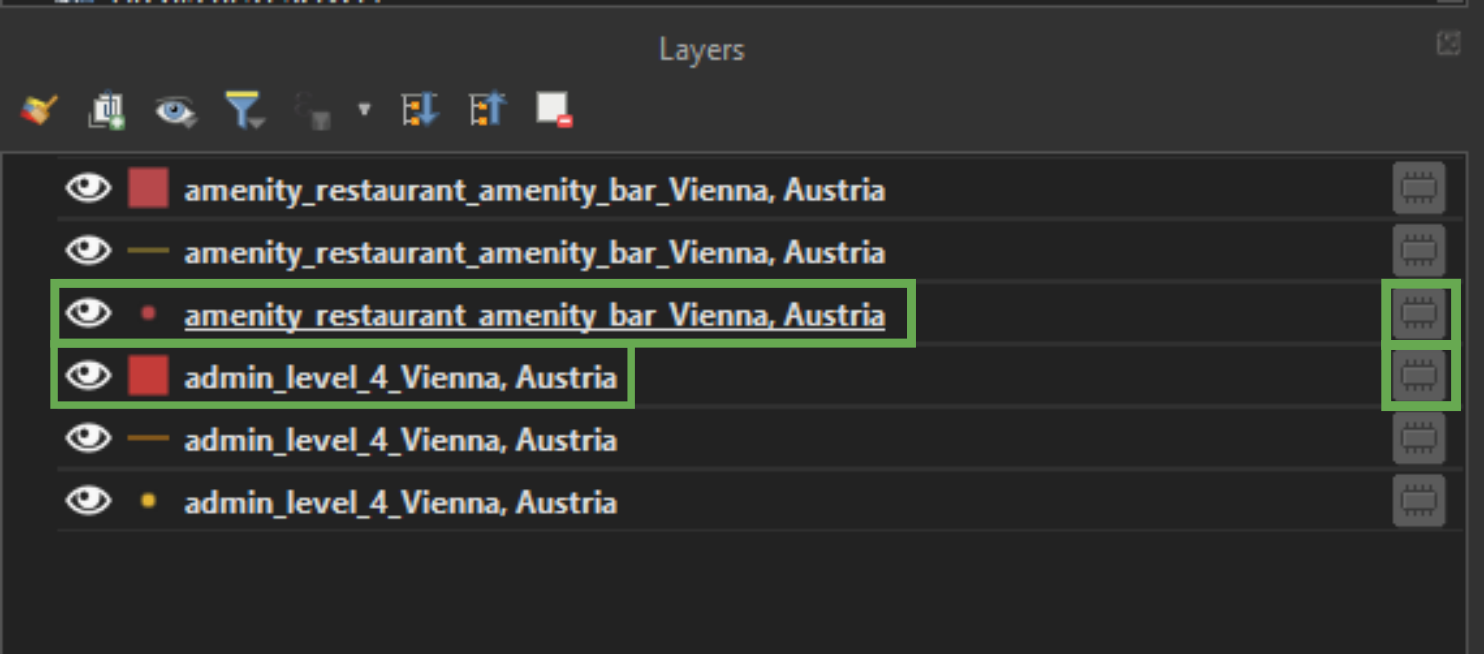
You will see that you have 6 temporary scratch layers in your legend now. You only need to keep the polygon layer of the administrative dataset and the point layer of the amenity. The rest can be removed (Rick click on layer > Remove layer).
We want to save the other layers, so 1) either click on the scratch layer symbol next to the layer or 2) right click on each layer> Make Permanent.
I recommend saving them as Geopackage with a spatial index, as this will make the analysis later more performant. Important: save the layer in an equal area projection! For this project we use the ETRS89-extended / LAEA Europe Projection (EPSG code 3035).
Next, change the displayed coordinate system of your project to 3035 as well.
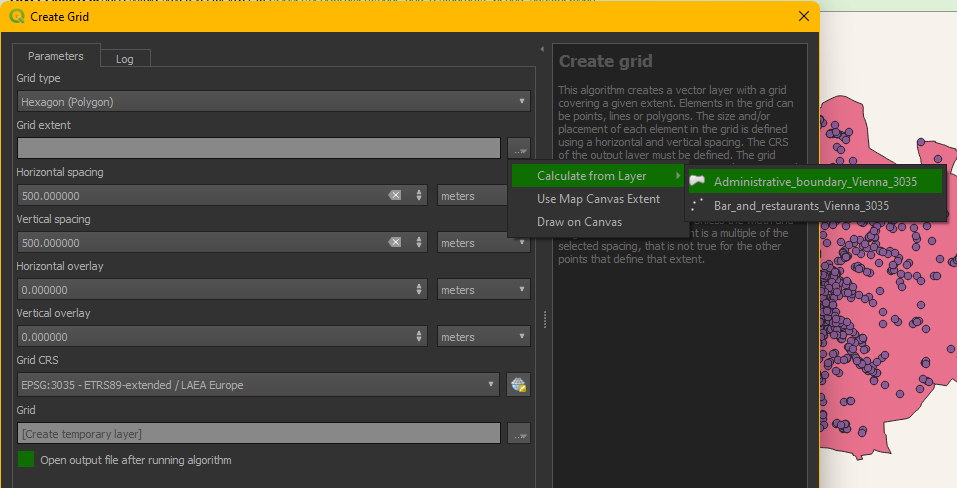
The next step is to calculate the hexagon grid. To calculate the grid, go to: Vector > Research Tools > Create Grid. We are using a hexagon shape, 500m horizontal and vertical spacing and calculate the extent from the administrative layer.
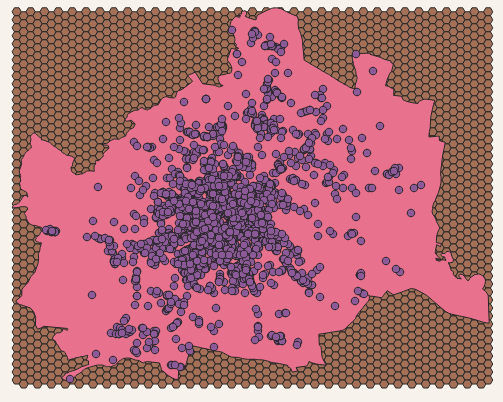
Now we have all 3 layers ready for the analysis: The gastronomy points, the administrative boundaries and the hexagon grid.
Data analysis
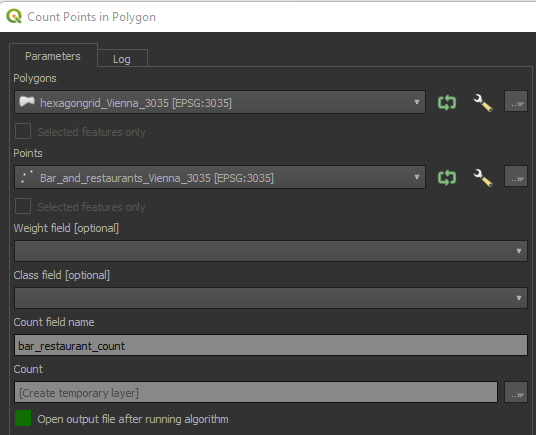
Next, we need to calculate how many points are in each hexagon cell. For this we go to: Vector> Analysis Tools> Count Points in Polygon. Use the settings below (left image):
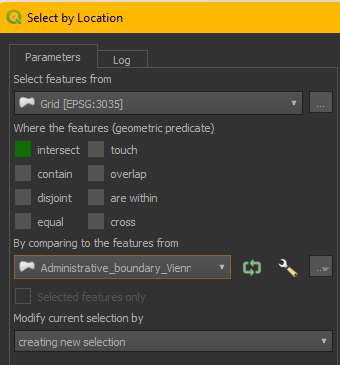
Finally, we only want to keep the hexagon cells that actually are within the administrative boundaries of Vienna. We get those cells with a spatial join. Get there by clicking Vector> Research Tools> Select By Location. Save the resulting selection by right click on the grid layer > Export> Save Selected Features As.
From data to map
We can switch off the other layers now and only keep the hexagon layer. Now we can start with the visualization of the data. We are going to be using a Yellow-Green-Blue color scheme from Colorbrewer. In case you want to import any of those colour schemes to QGIS, follow these steps.
Next, we are going to work on the layer styling. Open the symbology by right clicking on the grid layer> Properties> Symbology.
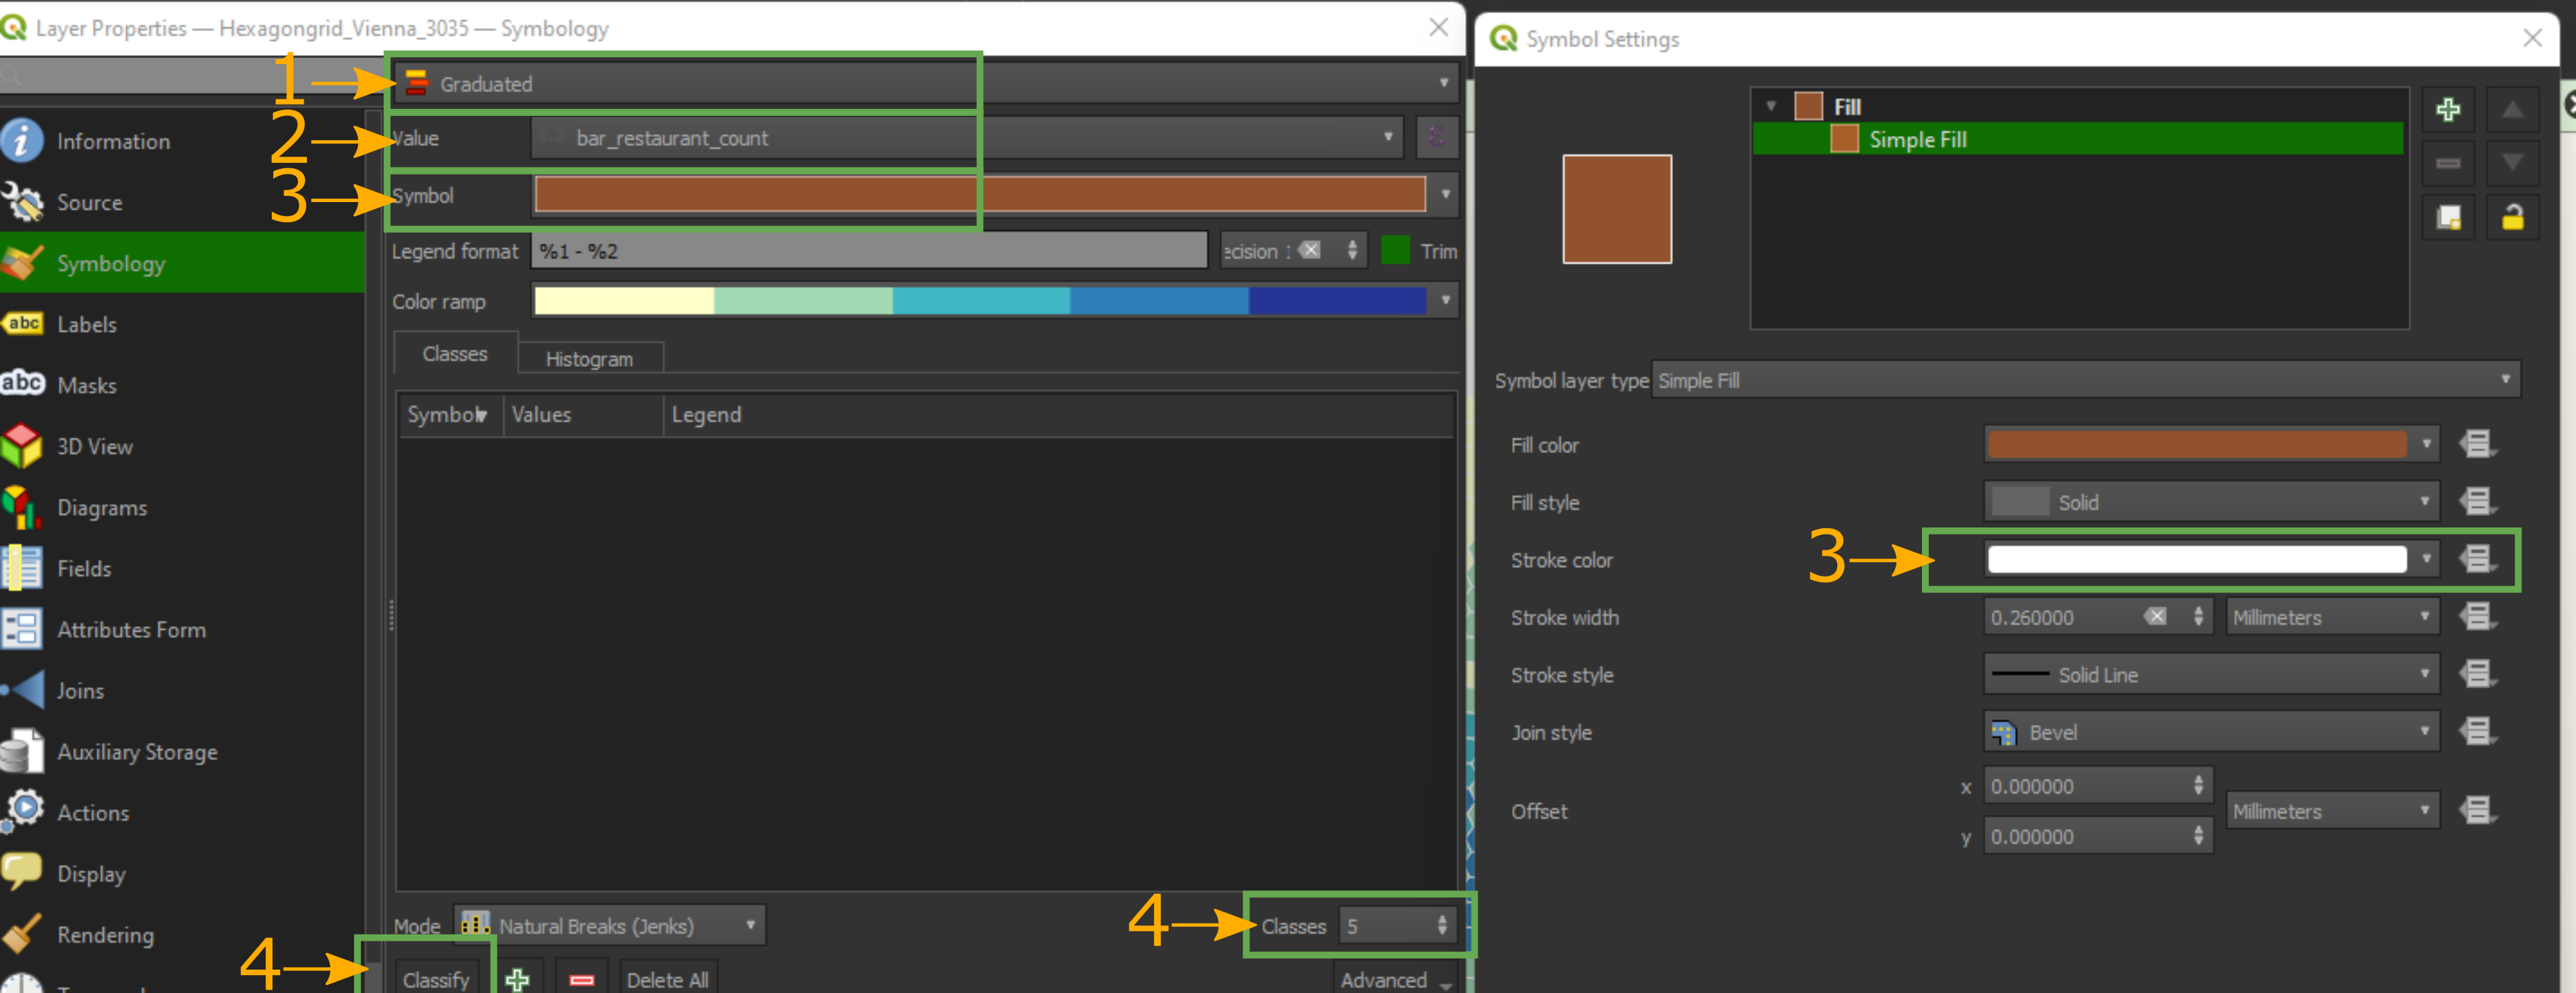
First of all, select Graduated symbology.
As Value select your calculated count of bars and restaurants per cell (bar_restaurant_count).
In the Symbol section, change the outline colour of all symbols to #ffffcc.
Select 5 classes and click classify.
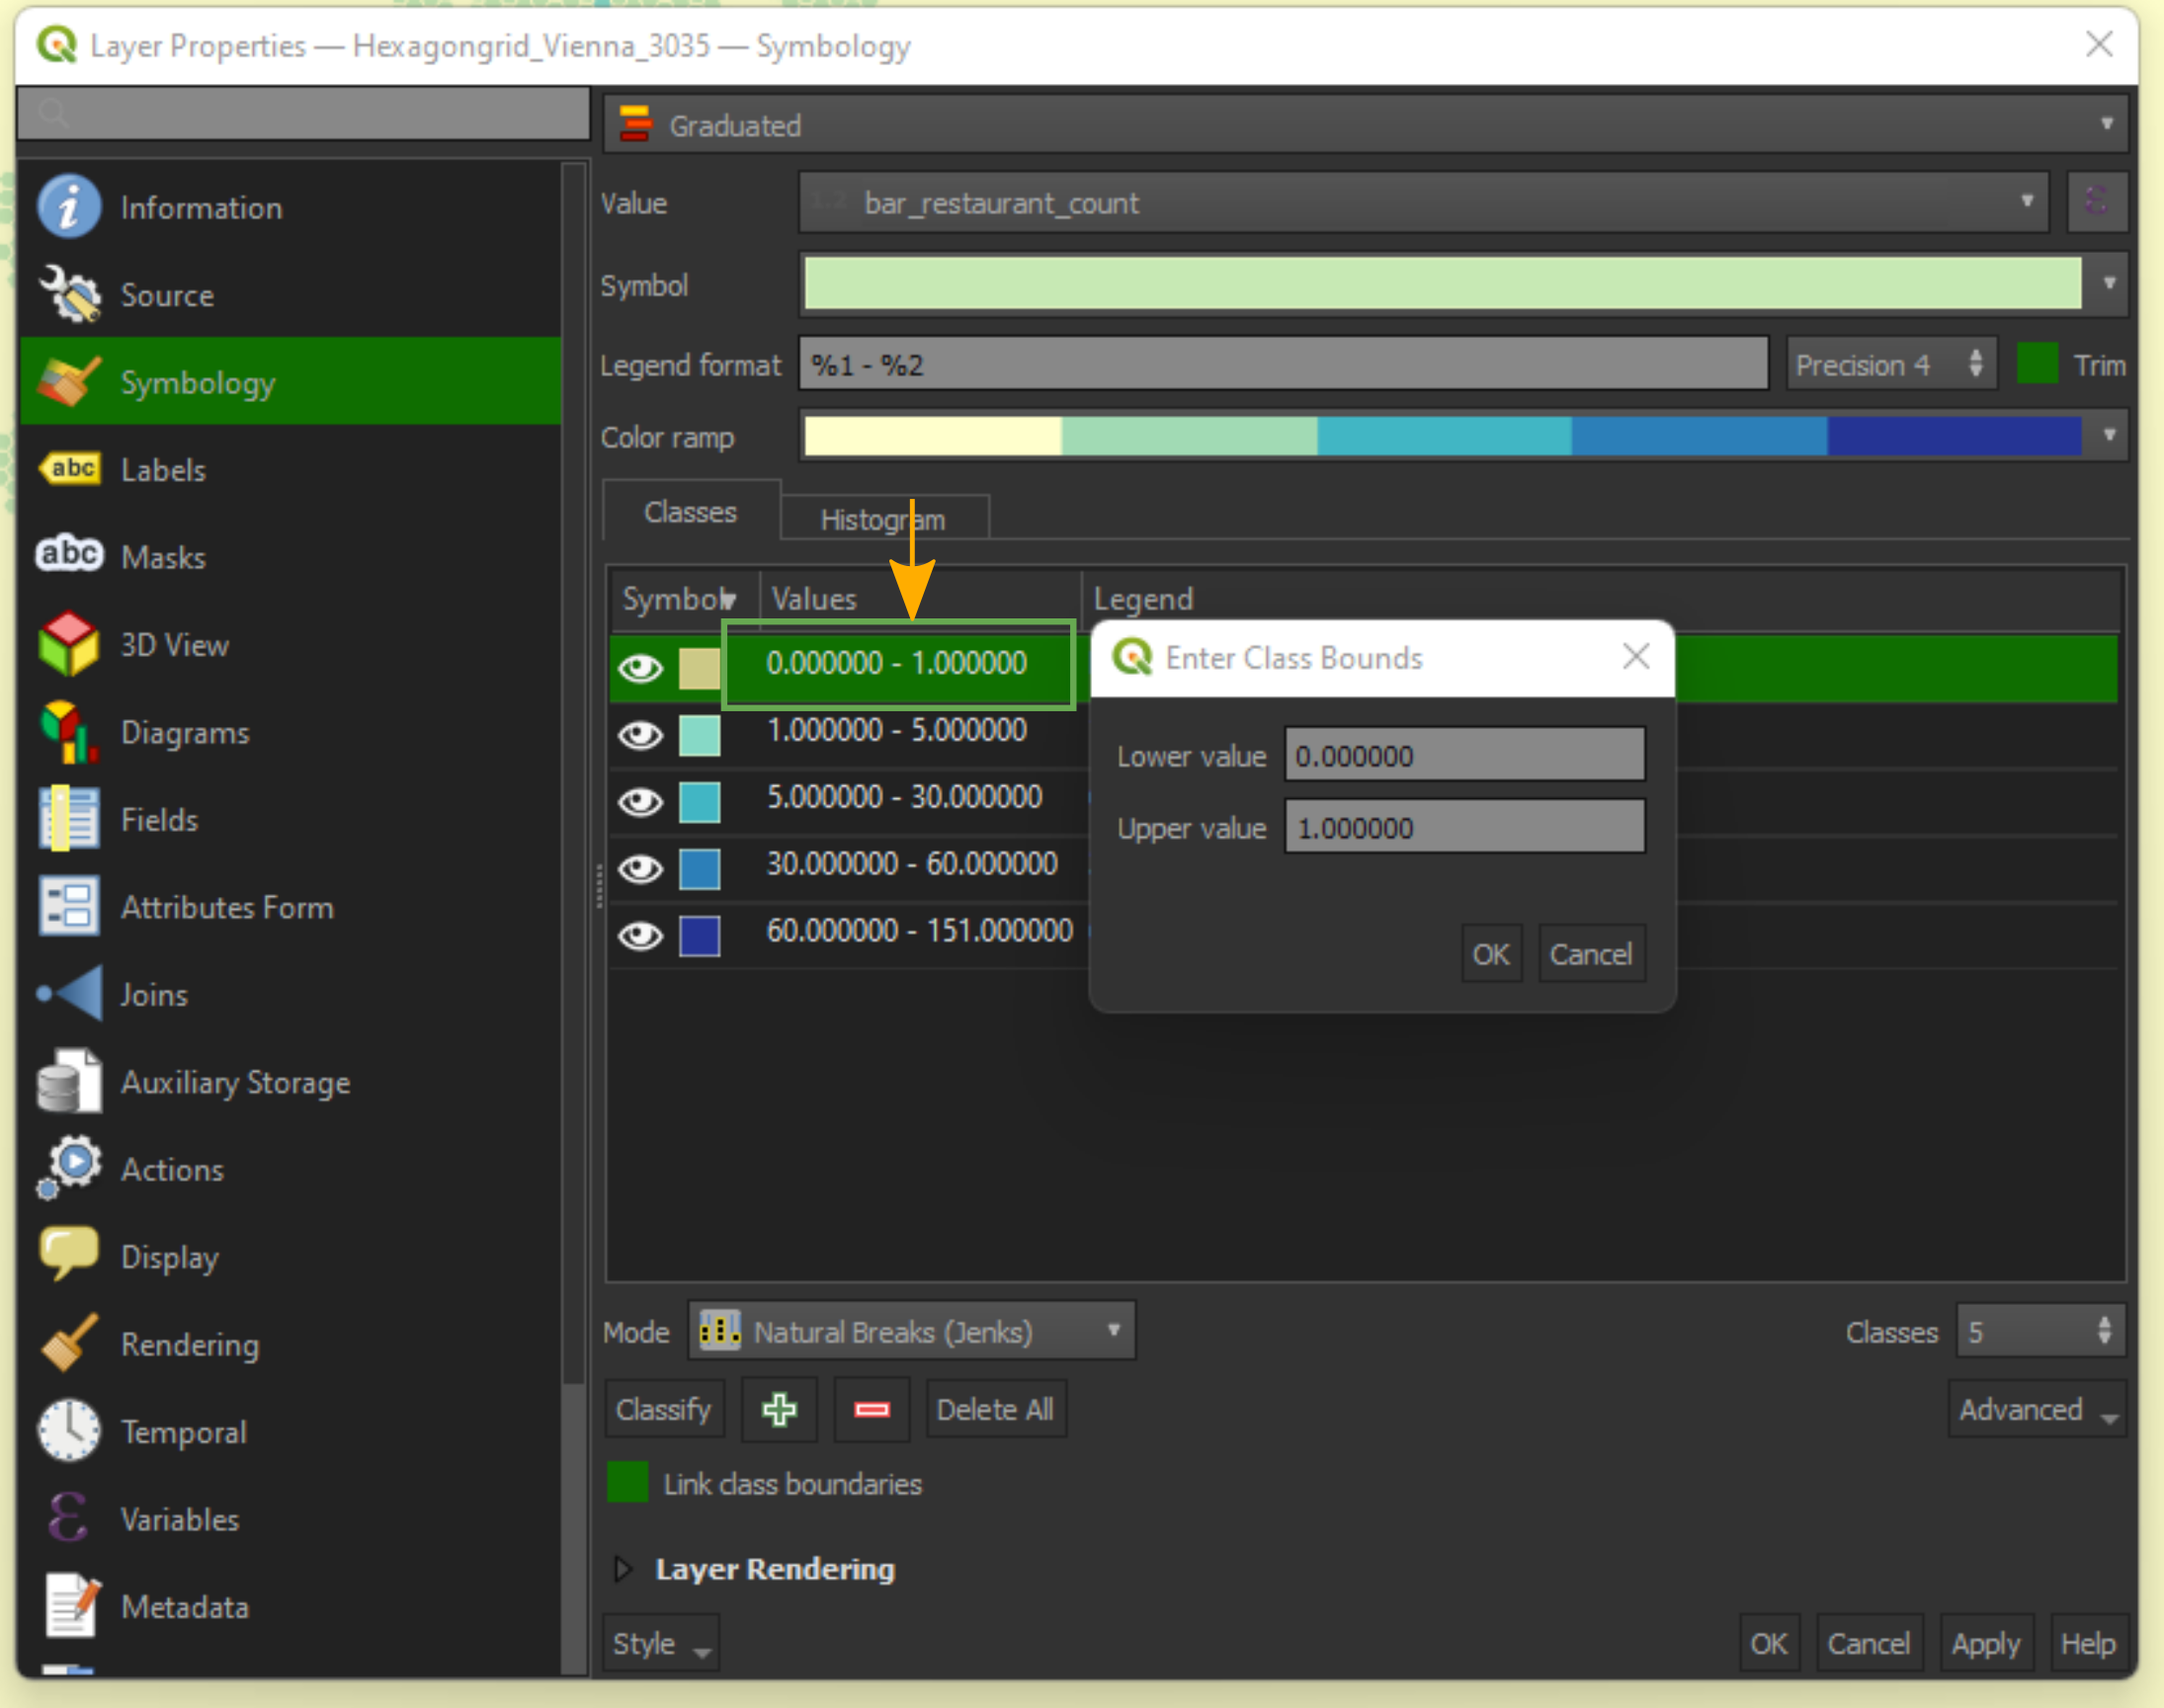
The next step is to change the the classes, their displayed names and their colours. You can change each of those by double clicking on each element e.g. to change the values of the categories, double click on it as shown in the image to the right.
Change the colours, values and legend names as follows:
0 – 1 | Label: “None” | #c7e9b4
1 – 5 | Label: 1 – 5 | #86d9c6
5 – 30 | Label: 6 – 30 | #41b6c4
30 – 60 | Label 31 – 60 | #2c7fb8
60 – 151 | Label: 61 – 151 | #253494
With this the layer styling is finished, and we can proceed to creating the map layout.
Map layout
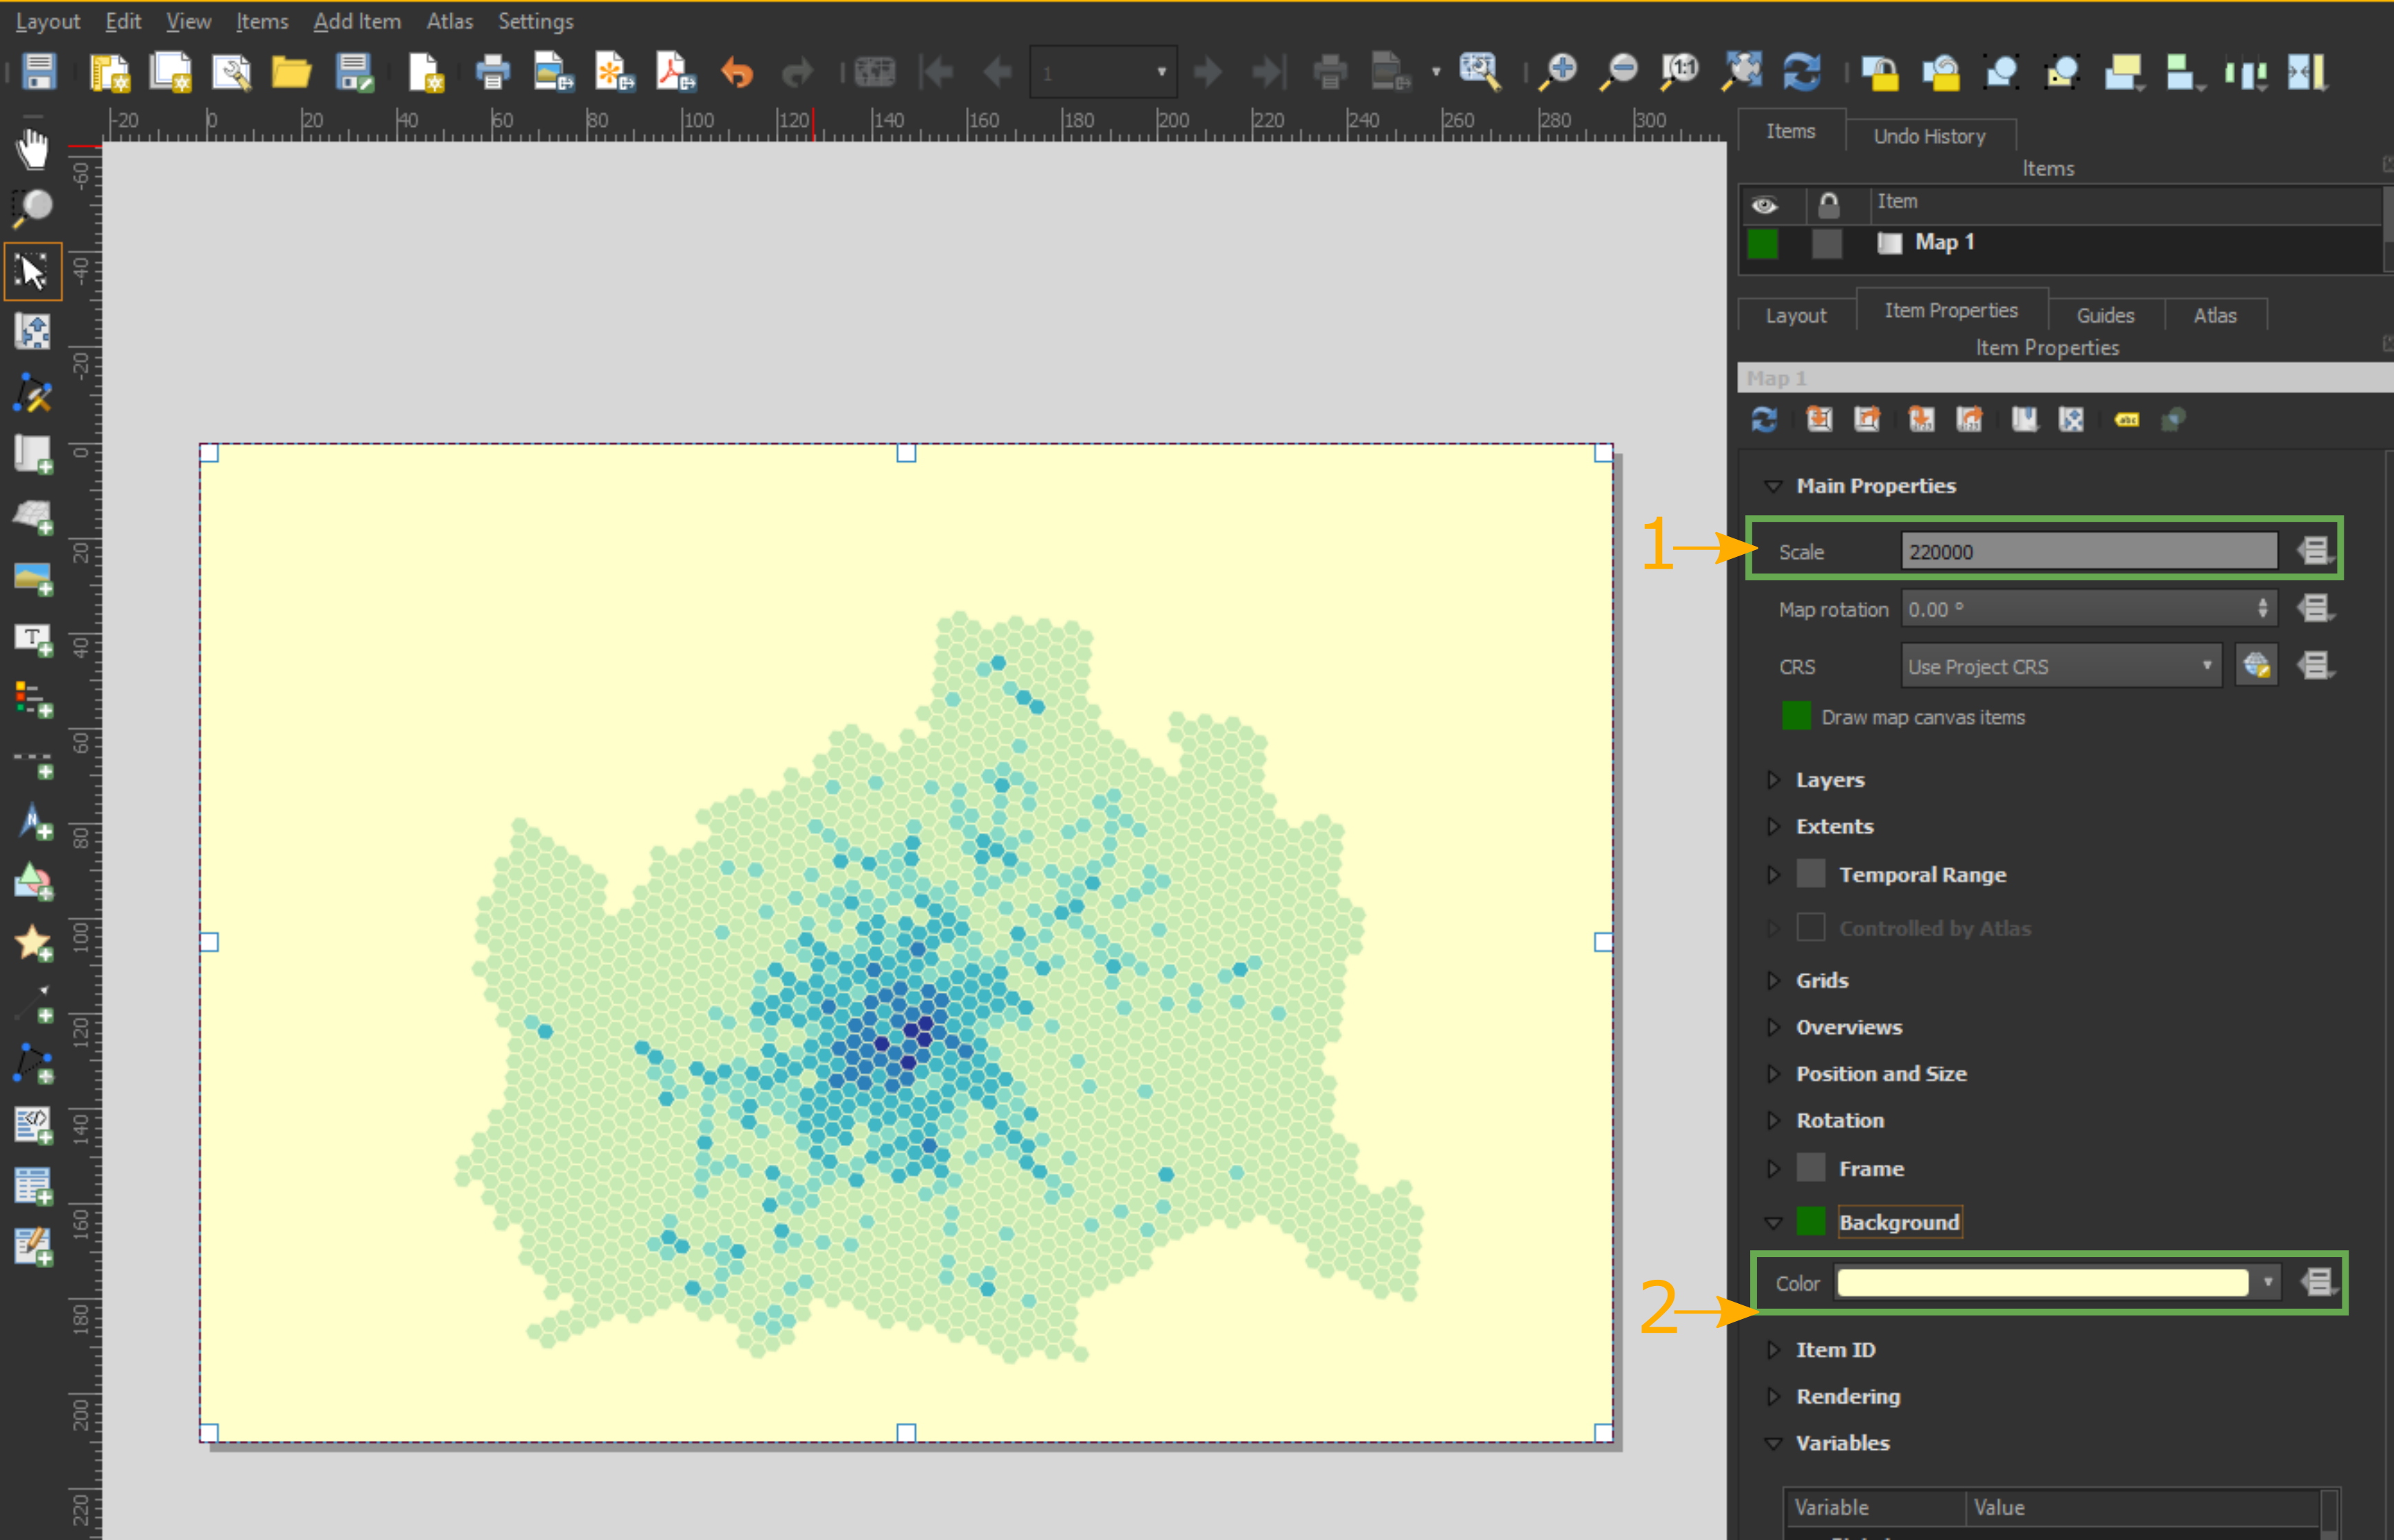
Create a new layout (Project> New Print Layout) and open it. Add the map to it (Add Item > Add Map). Place the map as shown in the image on the right. Then 1) set the scale to 22000 in the Item Properties on the right and 2) then change the background colour to #ffffcc.
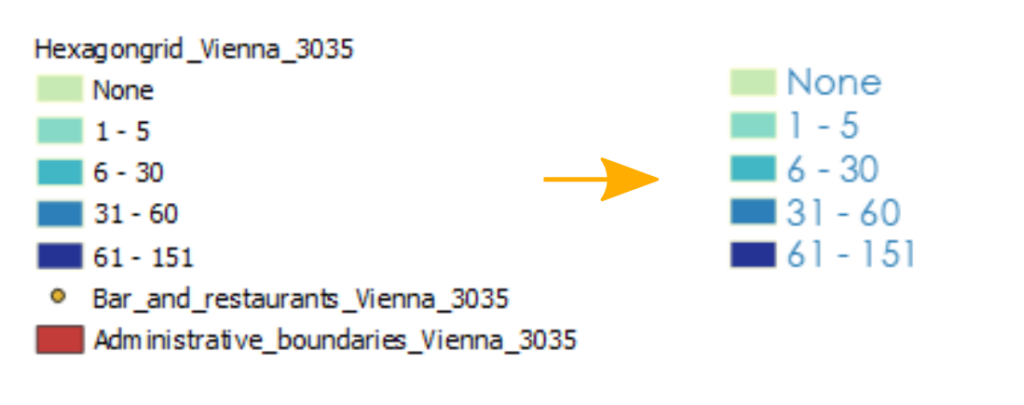
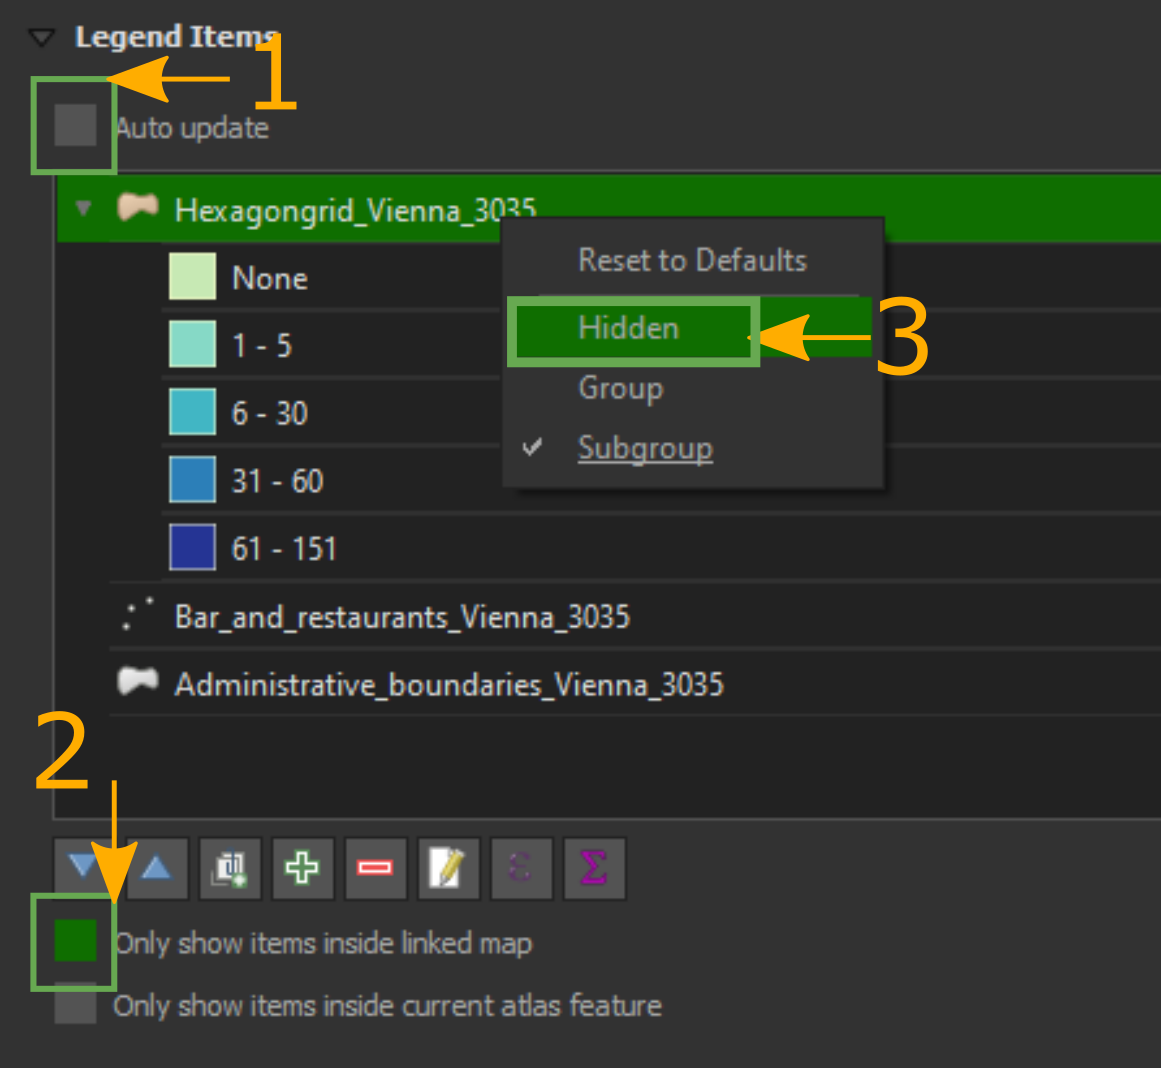
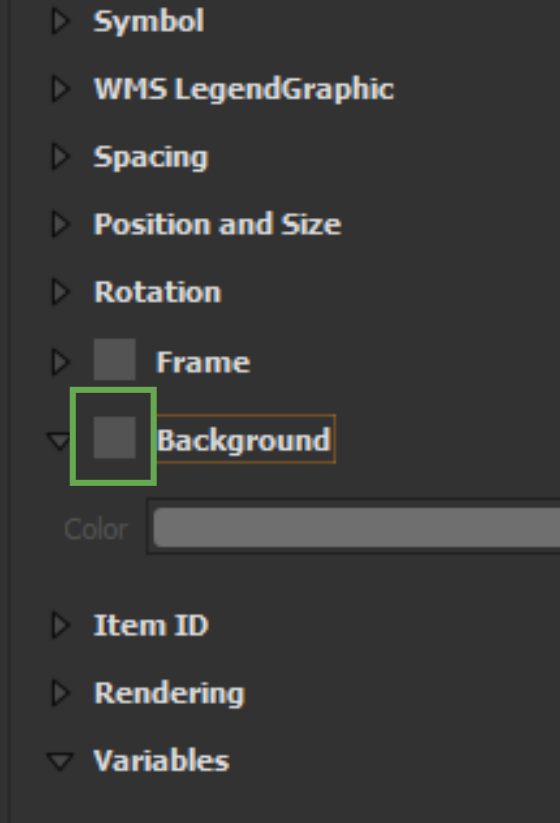
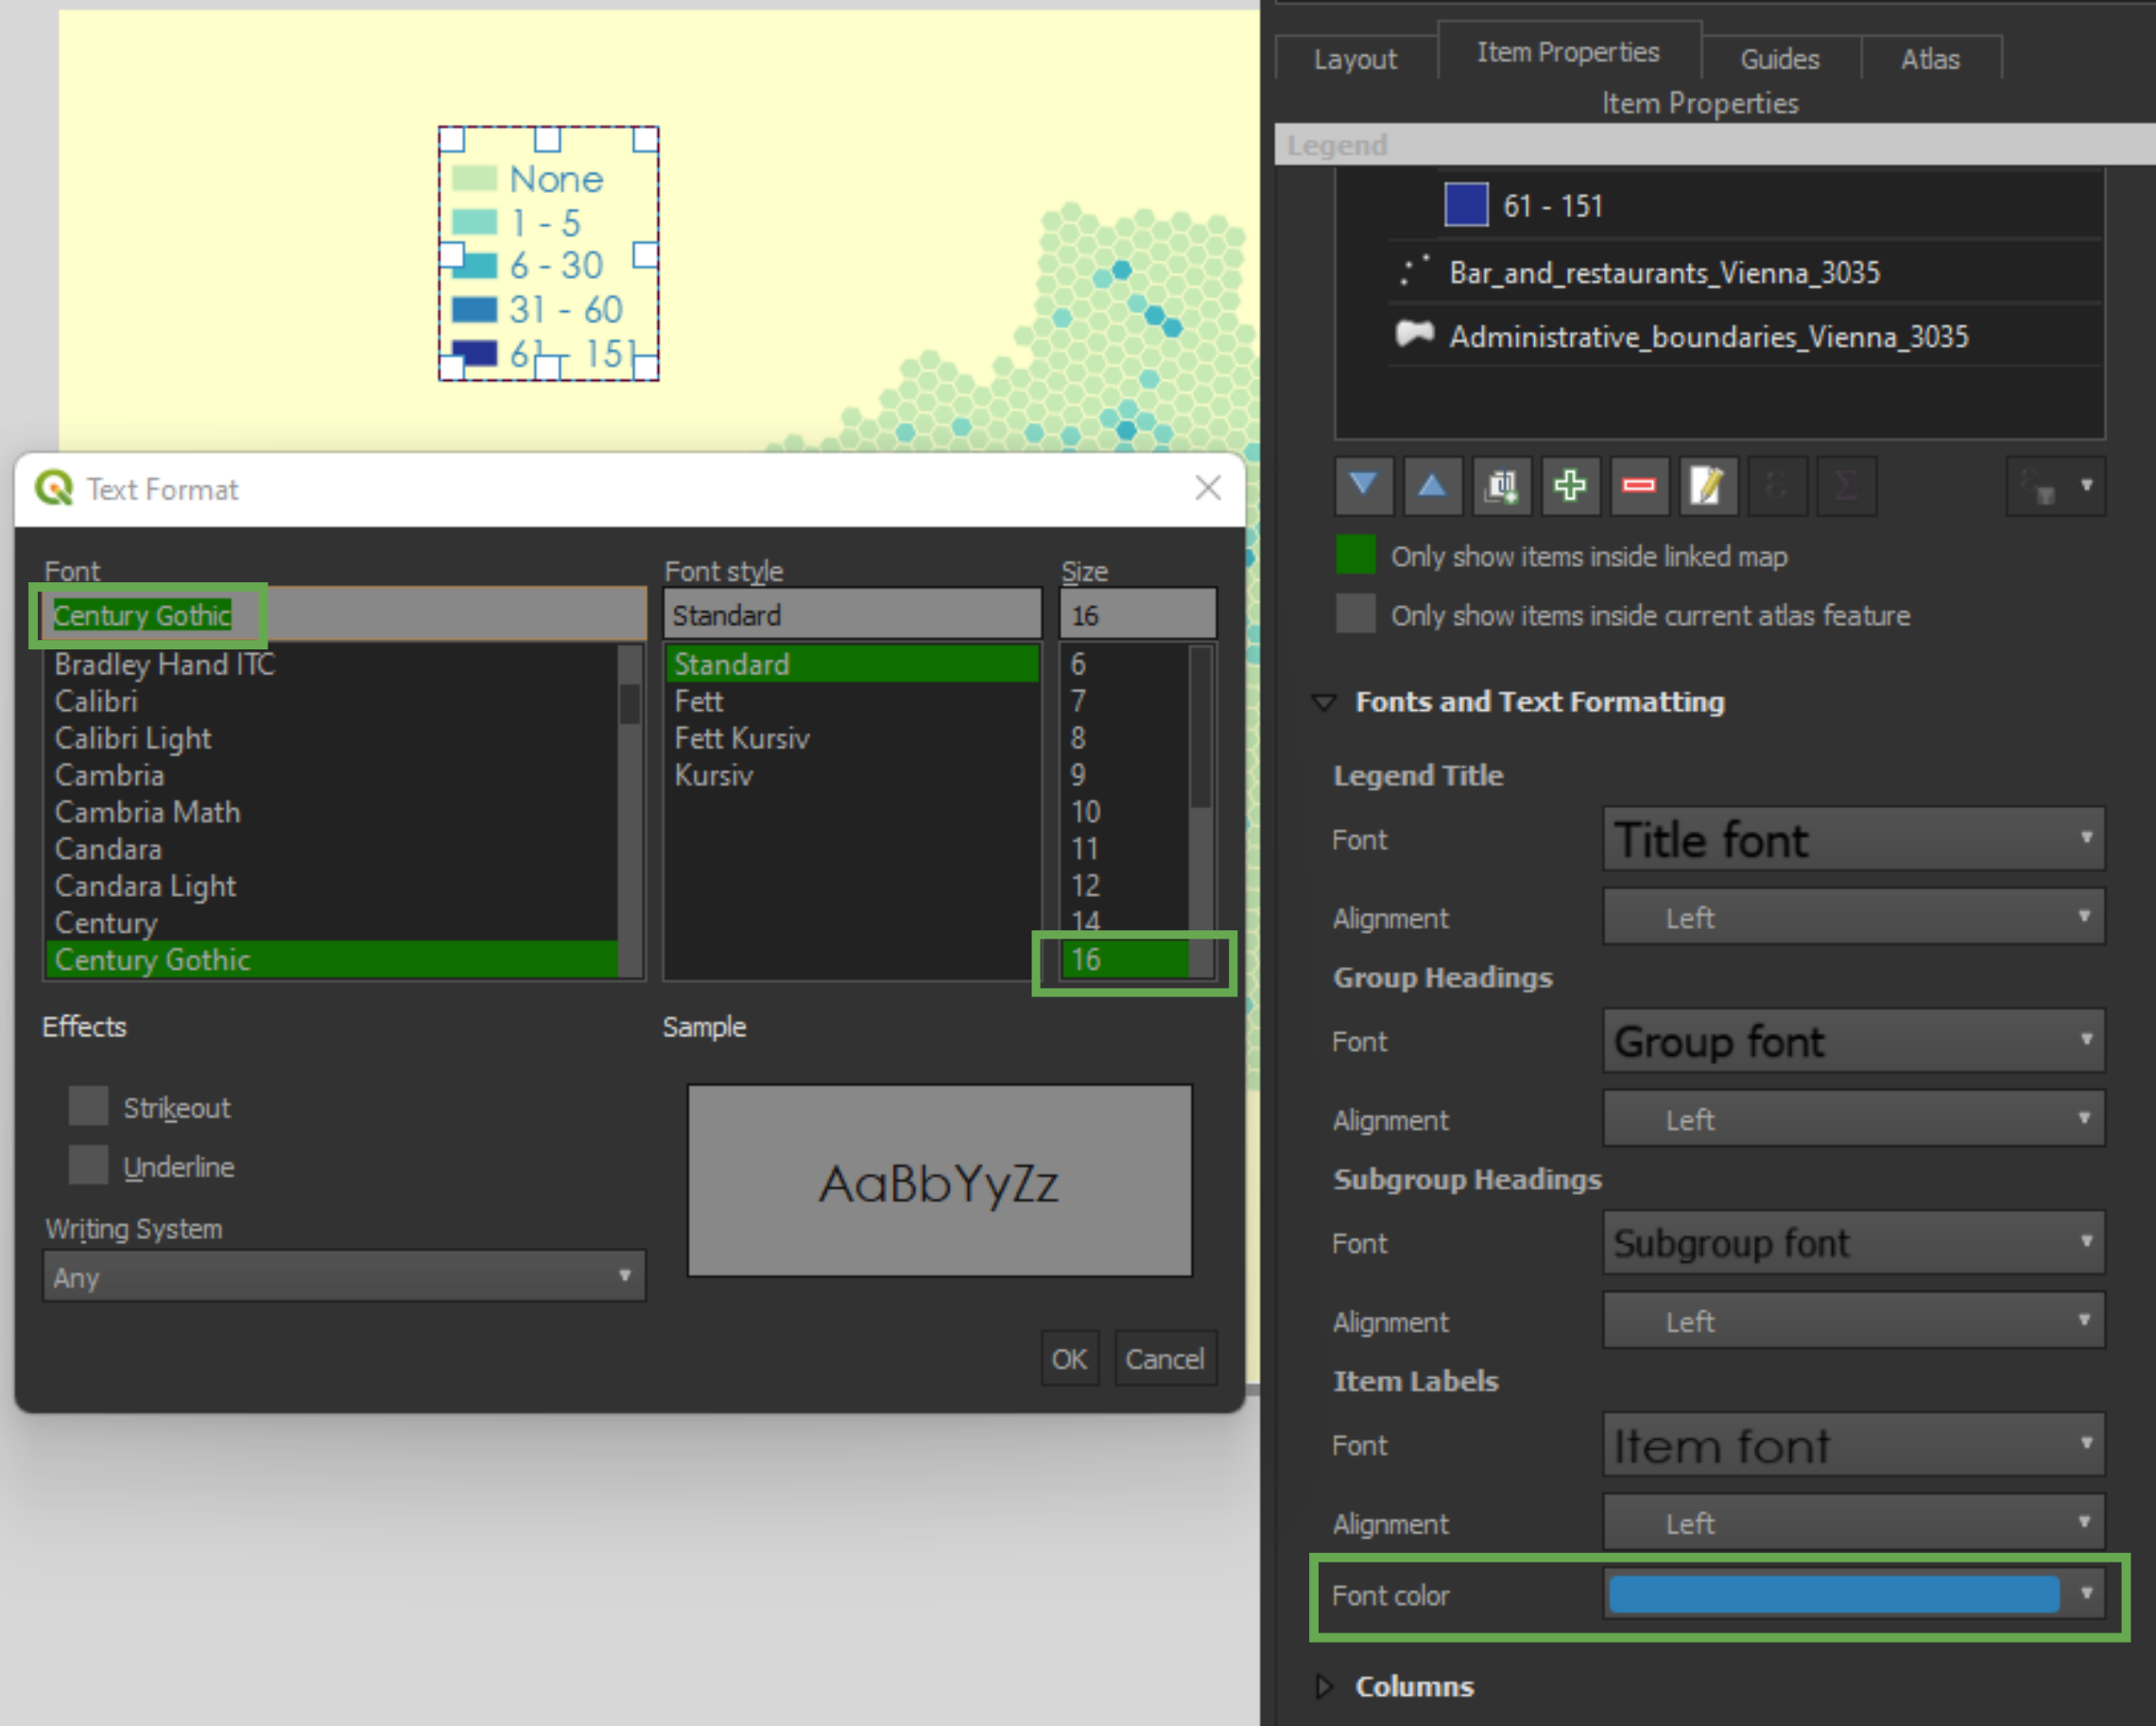
Next add the legend (Add Item > Add Legend). We will adjust the legend by removing the background and title and by changing the text font and colour. 1) First of all, select the legend in the map view and go to the Item Properties on the right and deselect “Auto update” and 2) select “Only show items inside linked map”. 3) Next, hide the title of the Legend by right clicking on the layer name > Hidden. As seen in the image in the middle, find the “Background” settings in “Item Properties” and deselect it. Finally, let us change the size and color of the font. Change the font to Century Gothic, font size 16, color #2c7fb8.
Lastly, we add the text fields to the map (Add Item > Add Label). Use the following settings:
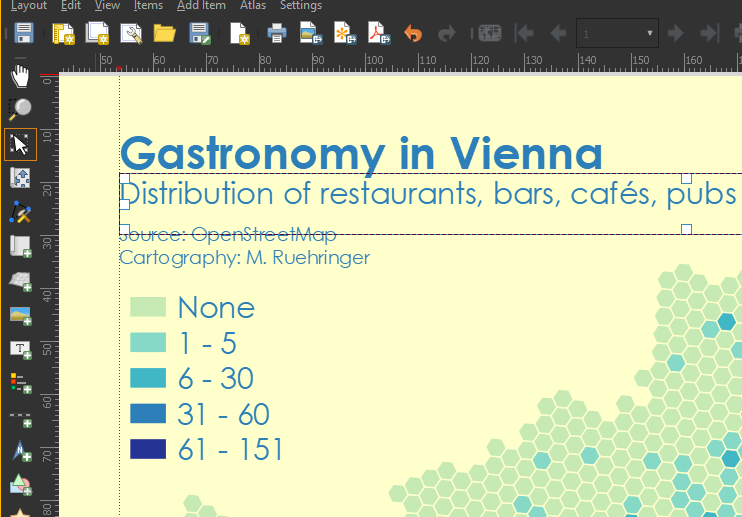
Main Title: Gastronomy in Vienna Font: Century Gothic, weight: bold, size 24pt, color: #2c7fb8
Subtitle: Distribution of restaurants, bars, cafés, pubs and other food related amenities Font: Century Gothic, weight: normal, size 16pt, color: #2c7fb8
Sources: Source: OpenStreetMap. Cartography: YOUR NAME Font: Century Gothic, weight: normal, size 10pt, color: #2c7fb8
Finally, align those elements as shown on the right (e.g. with the help of ruler lines). And voilà, our map is done!
Final considerations
You now know the tools to make a hexagon map yourself with QGIS. While this map has mostly an aesthetic purpose, you can also carry out meaningful analysis with it e.g. by analyzing traffic accident patterns.
Finally, you are some further links to do hexagon with other mapping tools: