Find below a selection of maps and applications, which I have created for professional, educational and private purposes.
Unfortunately, I am not allowed to share many of the maps created during my work.
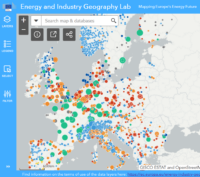
The Energy and Industry Geography Lab
The Energy and Industry Geography Lab is a one-of-a-kind geospatial mapping tool with energy-related spatial data. During my work at the European Commission I spearheaded the design and implementation of this WebGIS tool.
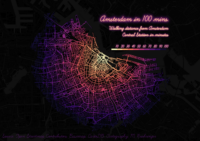
Amsterdam in 100 minutes
This map was created as part of the #30DayMapChallenge 2022 (Topic: Lines).
Click here to see original map
Tools: QGIS, Inkscape
Data source: Open Street Map – Geofabrik GmbH
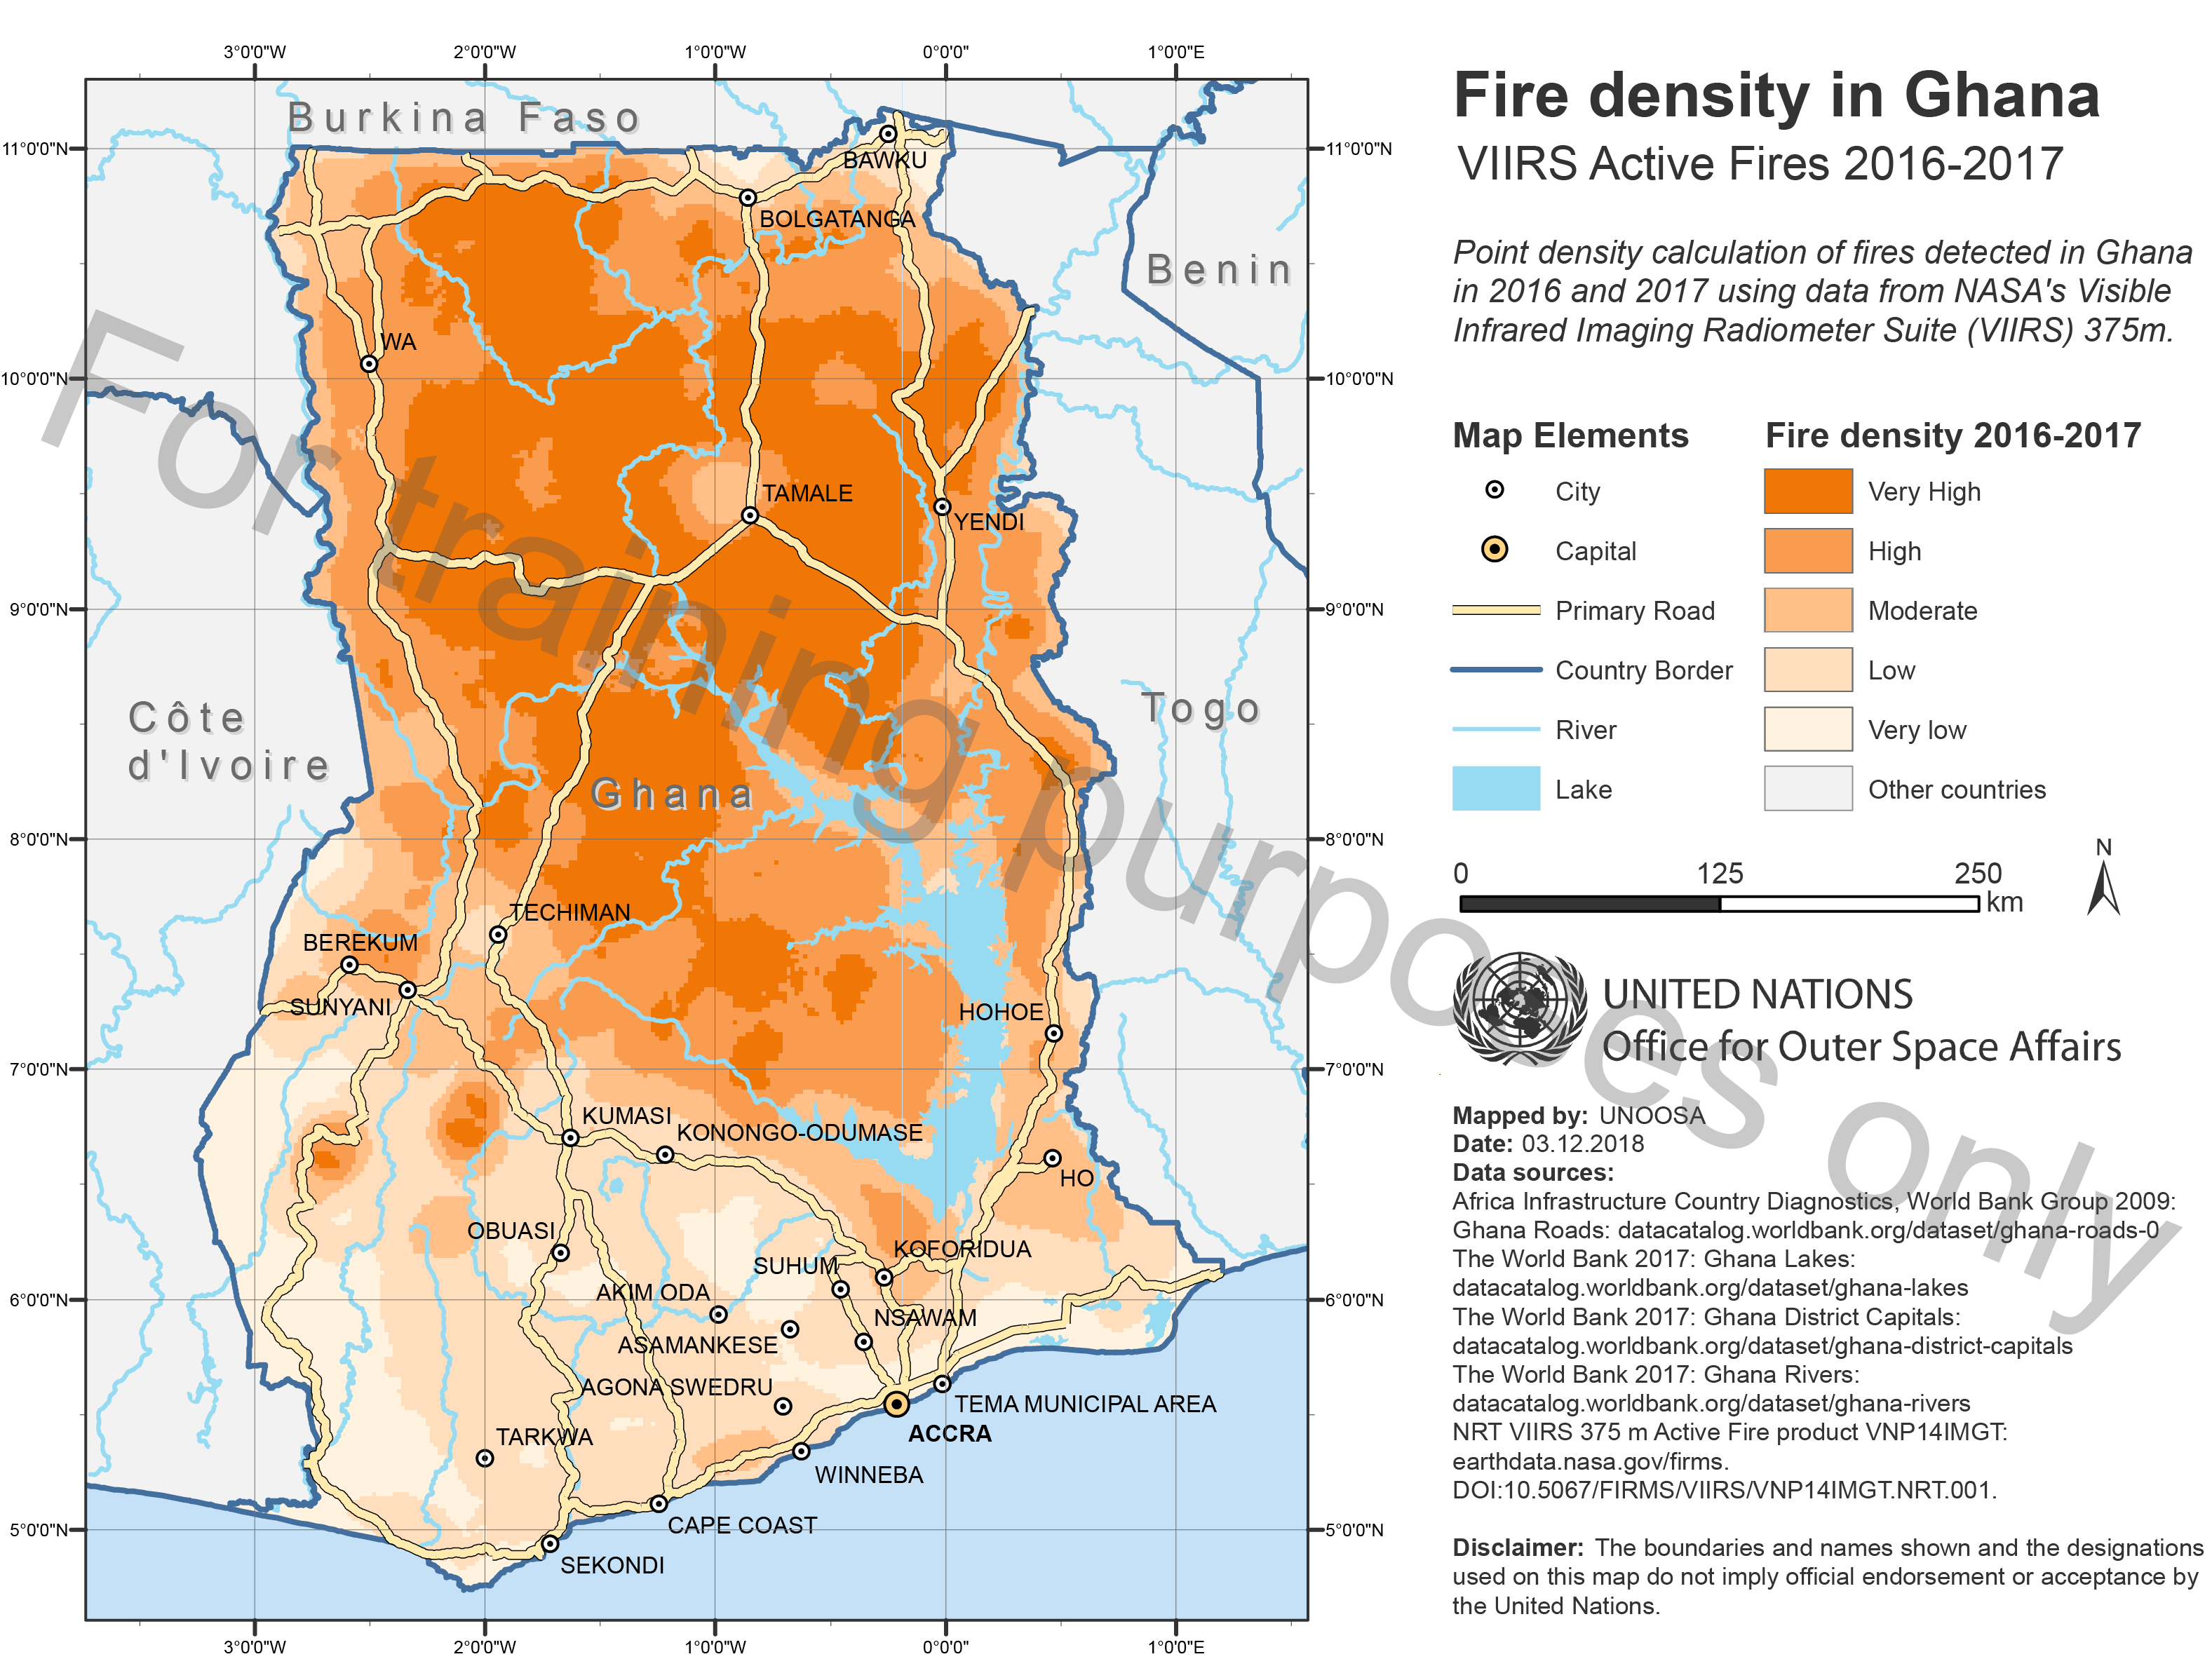
Fire densitiy in Ghana
The density of fire events was calculated using VIIRS fire detection point data as part of my internship at UNOOSA. Tool: Google Earth Engine, QGIS Data source: see map
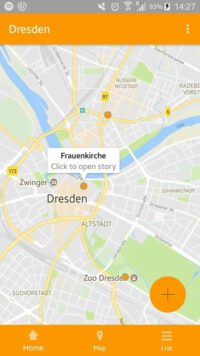
TravelDiary
A map-based phone app that allows users to use geospatial technology for an enhanced travel experience. Users can store locations of interest in a diary, and add own information and notes to it. This app was developed as part of an assignment from TU Dresden. Programming: Maria Ruehringer, Design: Moris Zahtila
Link to mock-up can be provided at request.
Tools: Java, XML
Source: Google Maps, TU Dresden
Normalized burn ratio in Algeria
I calculated the normalized burn ratio to identify areas that have burned in the past and quantified the severity of the event. This was made in the course of my internship at UNOOSA.Tool: Google Earth Engine, QGIS Data source: Copernicus Sentinel 2
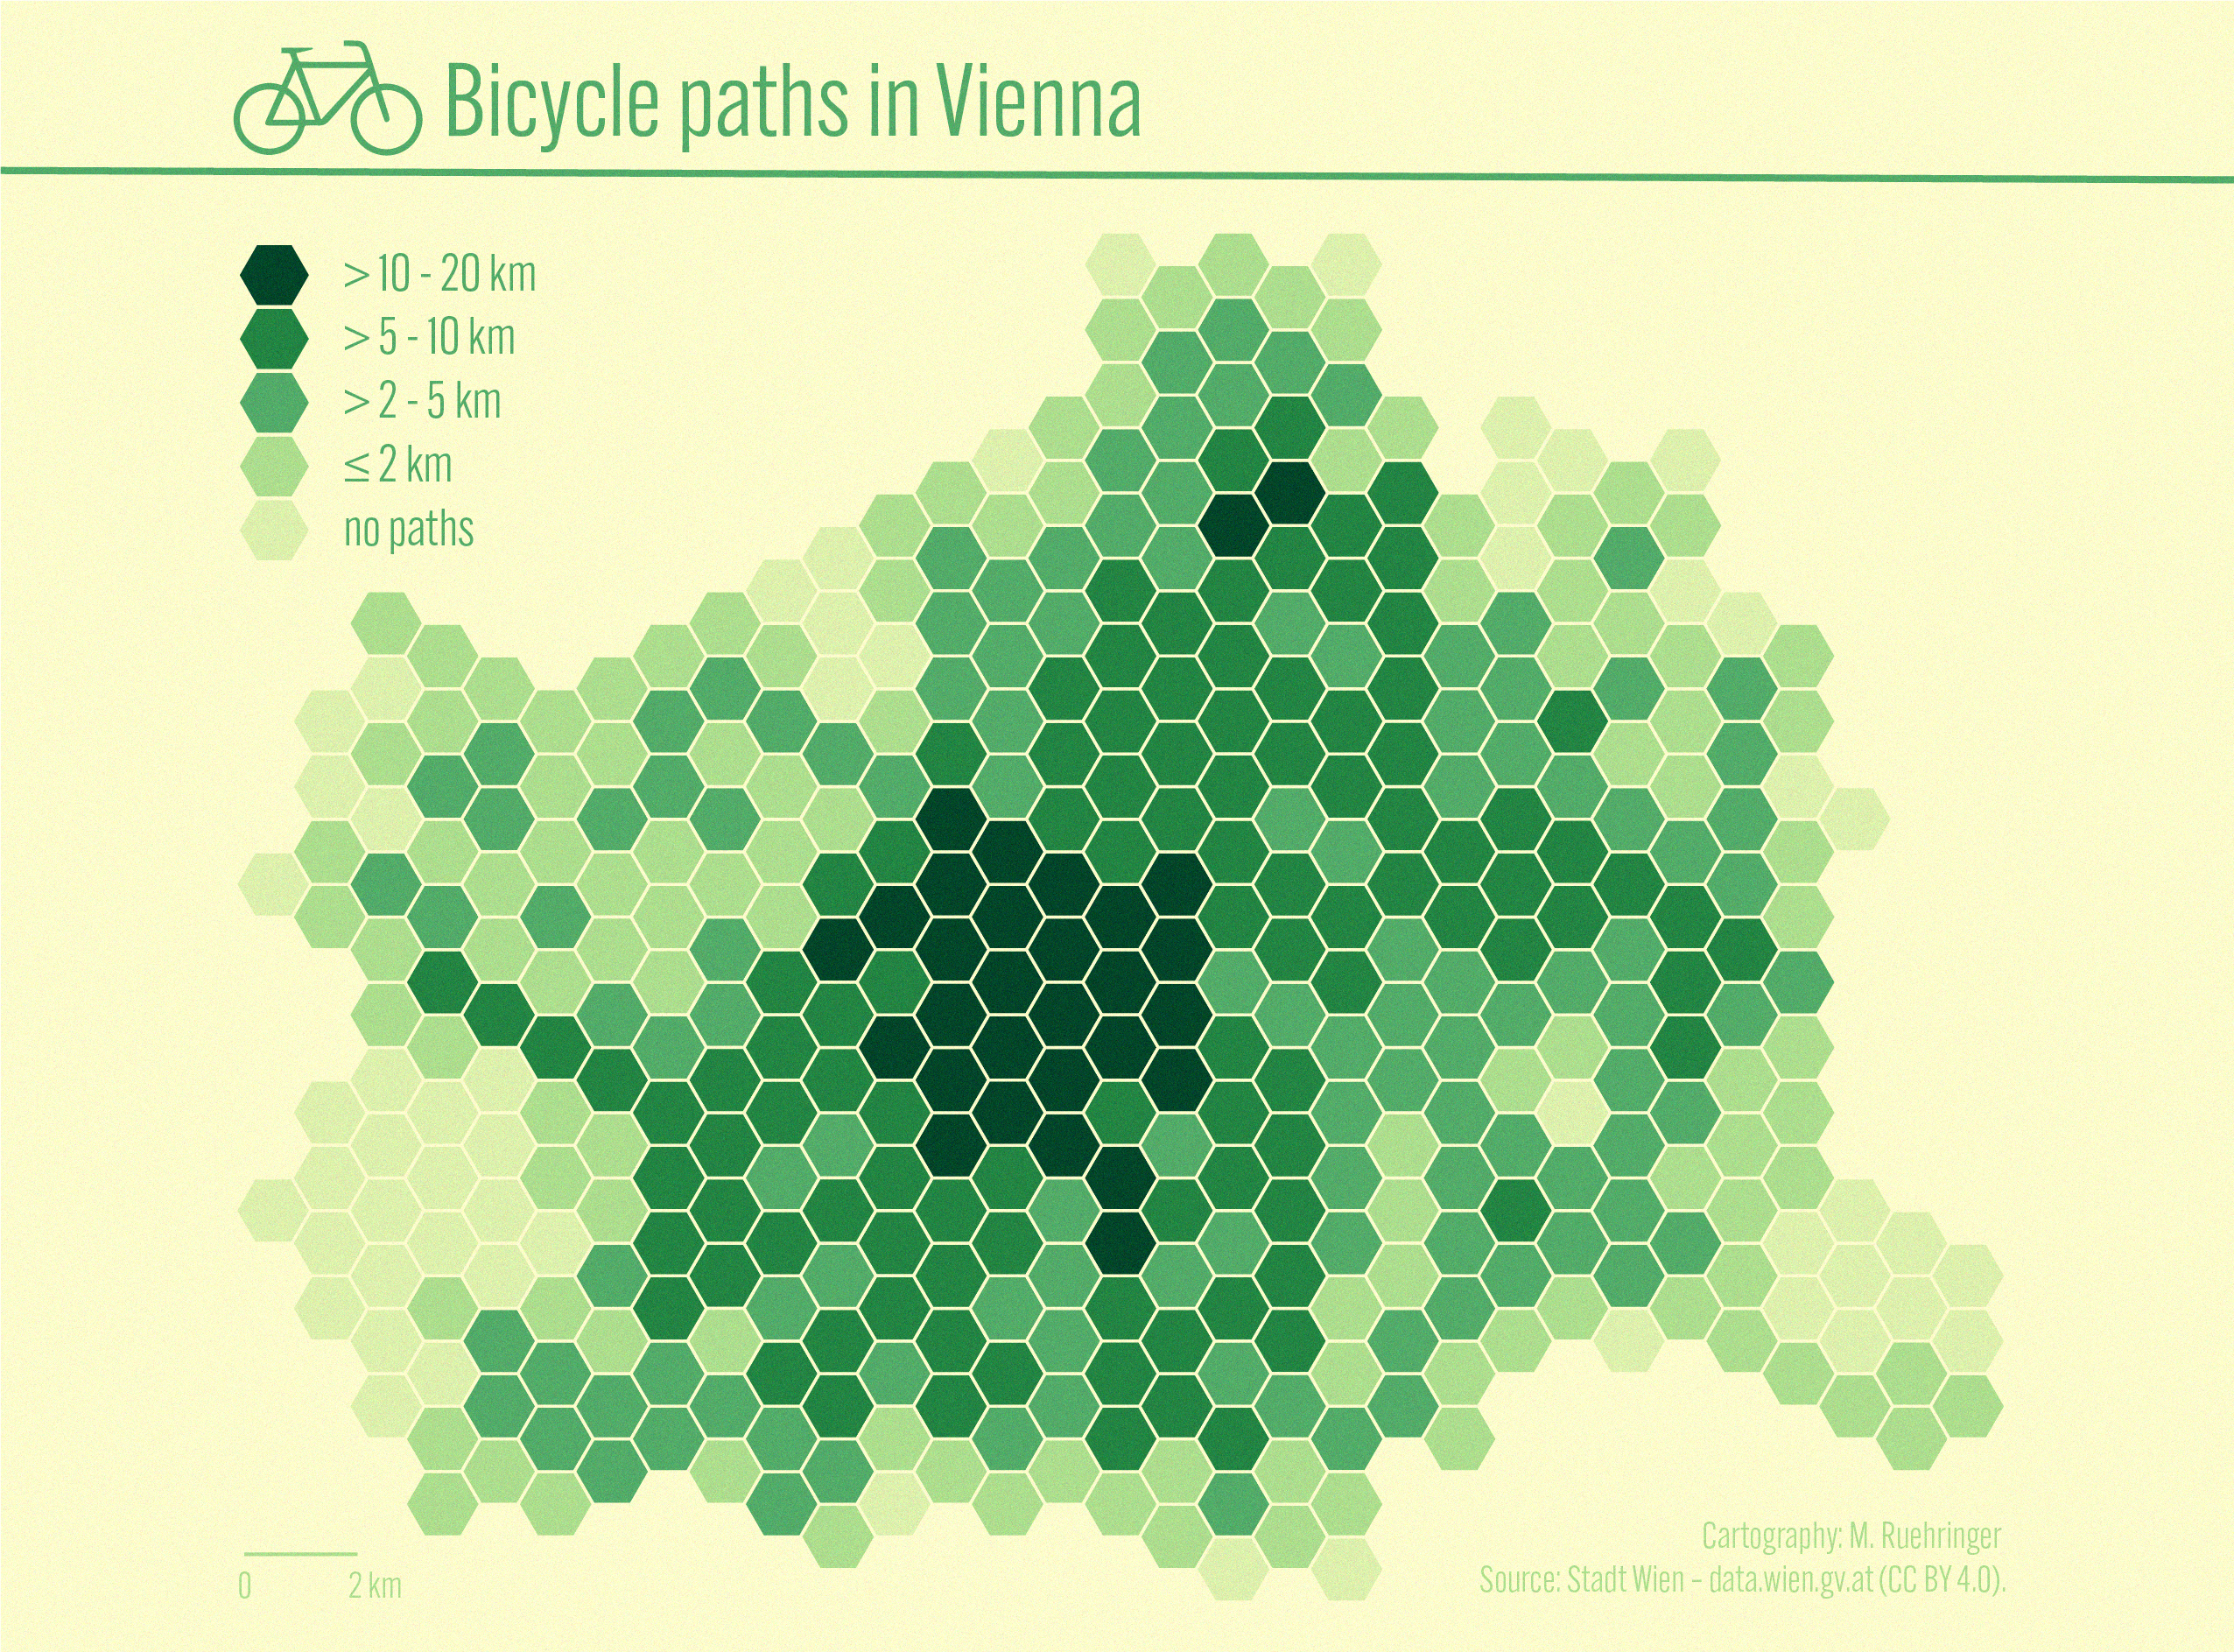
Bicycle paths in Vienna
This map was created as part of the #30DayMapChallenge 2021 (Topic: Hexagon). It shows the length of bike paths within each hexagon feature.
Click here to see original map
Tools: QGIS, Adobe Illustrator
Data source: Stadt Wien – https://data.wien.gv.at (CC BY 4.0)
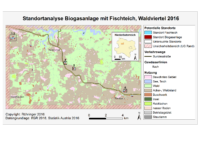
Location analysis for biogas plant
This project carried out location analysis to identify suitable spots for a biogas plant.
Tools: ArcMap
Data source: see map
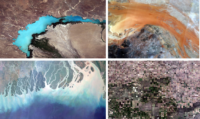
Passive remote sensing
Exported composites from Sentinel 2 satellite images to be used as presentation material.
Tool: Google Earth Engine
Data source: Copernicus Sentinel 2
Energy consumption in the EU
A dorling cartogram showing the energy consumption in the EU.
Click here to see original map
Tools: R
Data source: See map
Munich points of interest
Map to help visitors navigate in the surrounding area of TU Munich.
Tool: ArcMap, Inkscape
Data source: see map
An der schönen blauen Donau
This map was developed in the course of a map design training, and aims to promote sights to tourists along the Danube in Austria.
Click here to see original map
Tools: QGIS, Adobe Illustrator
Data source: see map
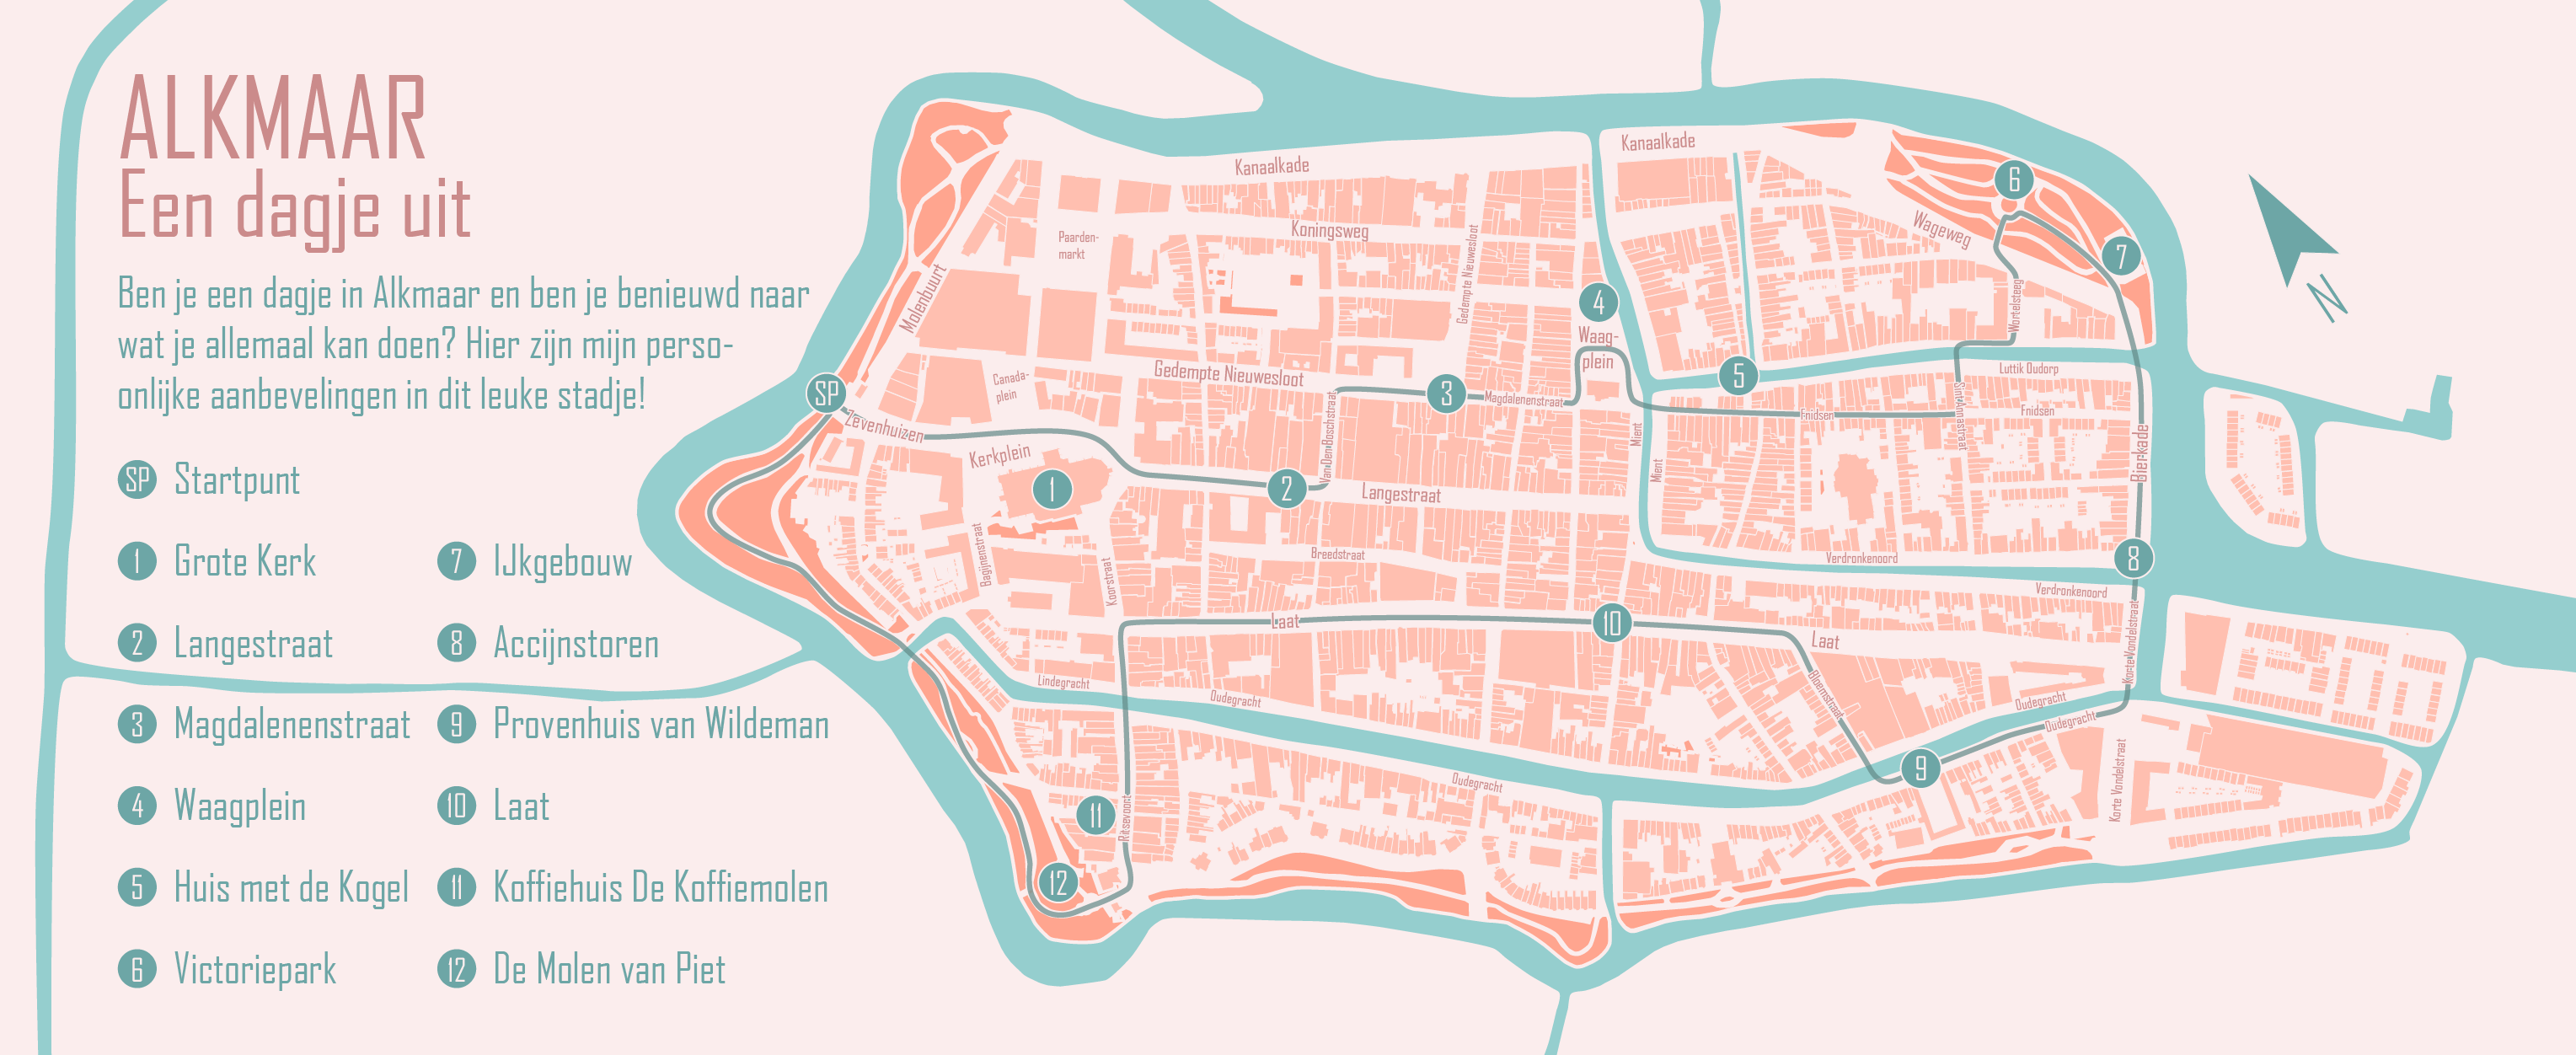
Alkmaar – Een dagje uit
Having moved to Alkmaar in 2019, I got to explore a lot of nice places in this beautiful city. I compiled my favourite POIs in the city centre into this map. The layout of the map is designed to be used as folder, which a tourist could carry in their hand while exploring the city.
Tools: QGIS, Adobe Illustrator
Data source: Open Street Map – Geofabrik GmbH (2019)
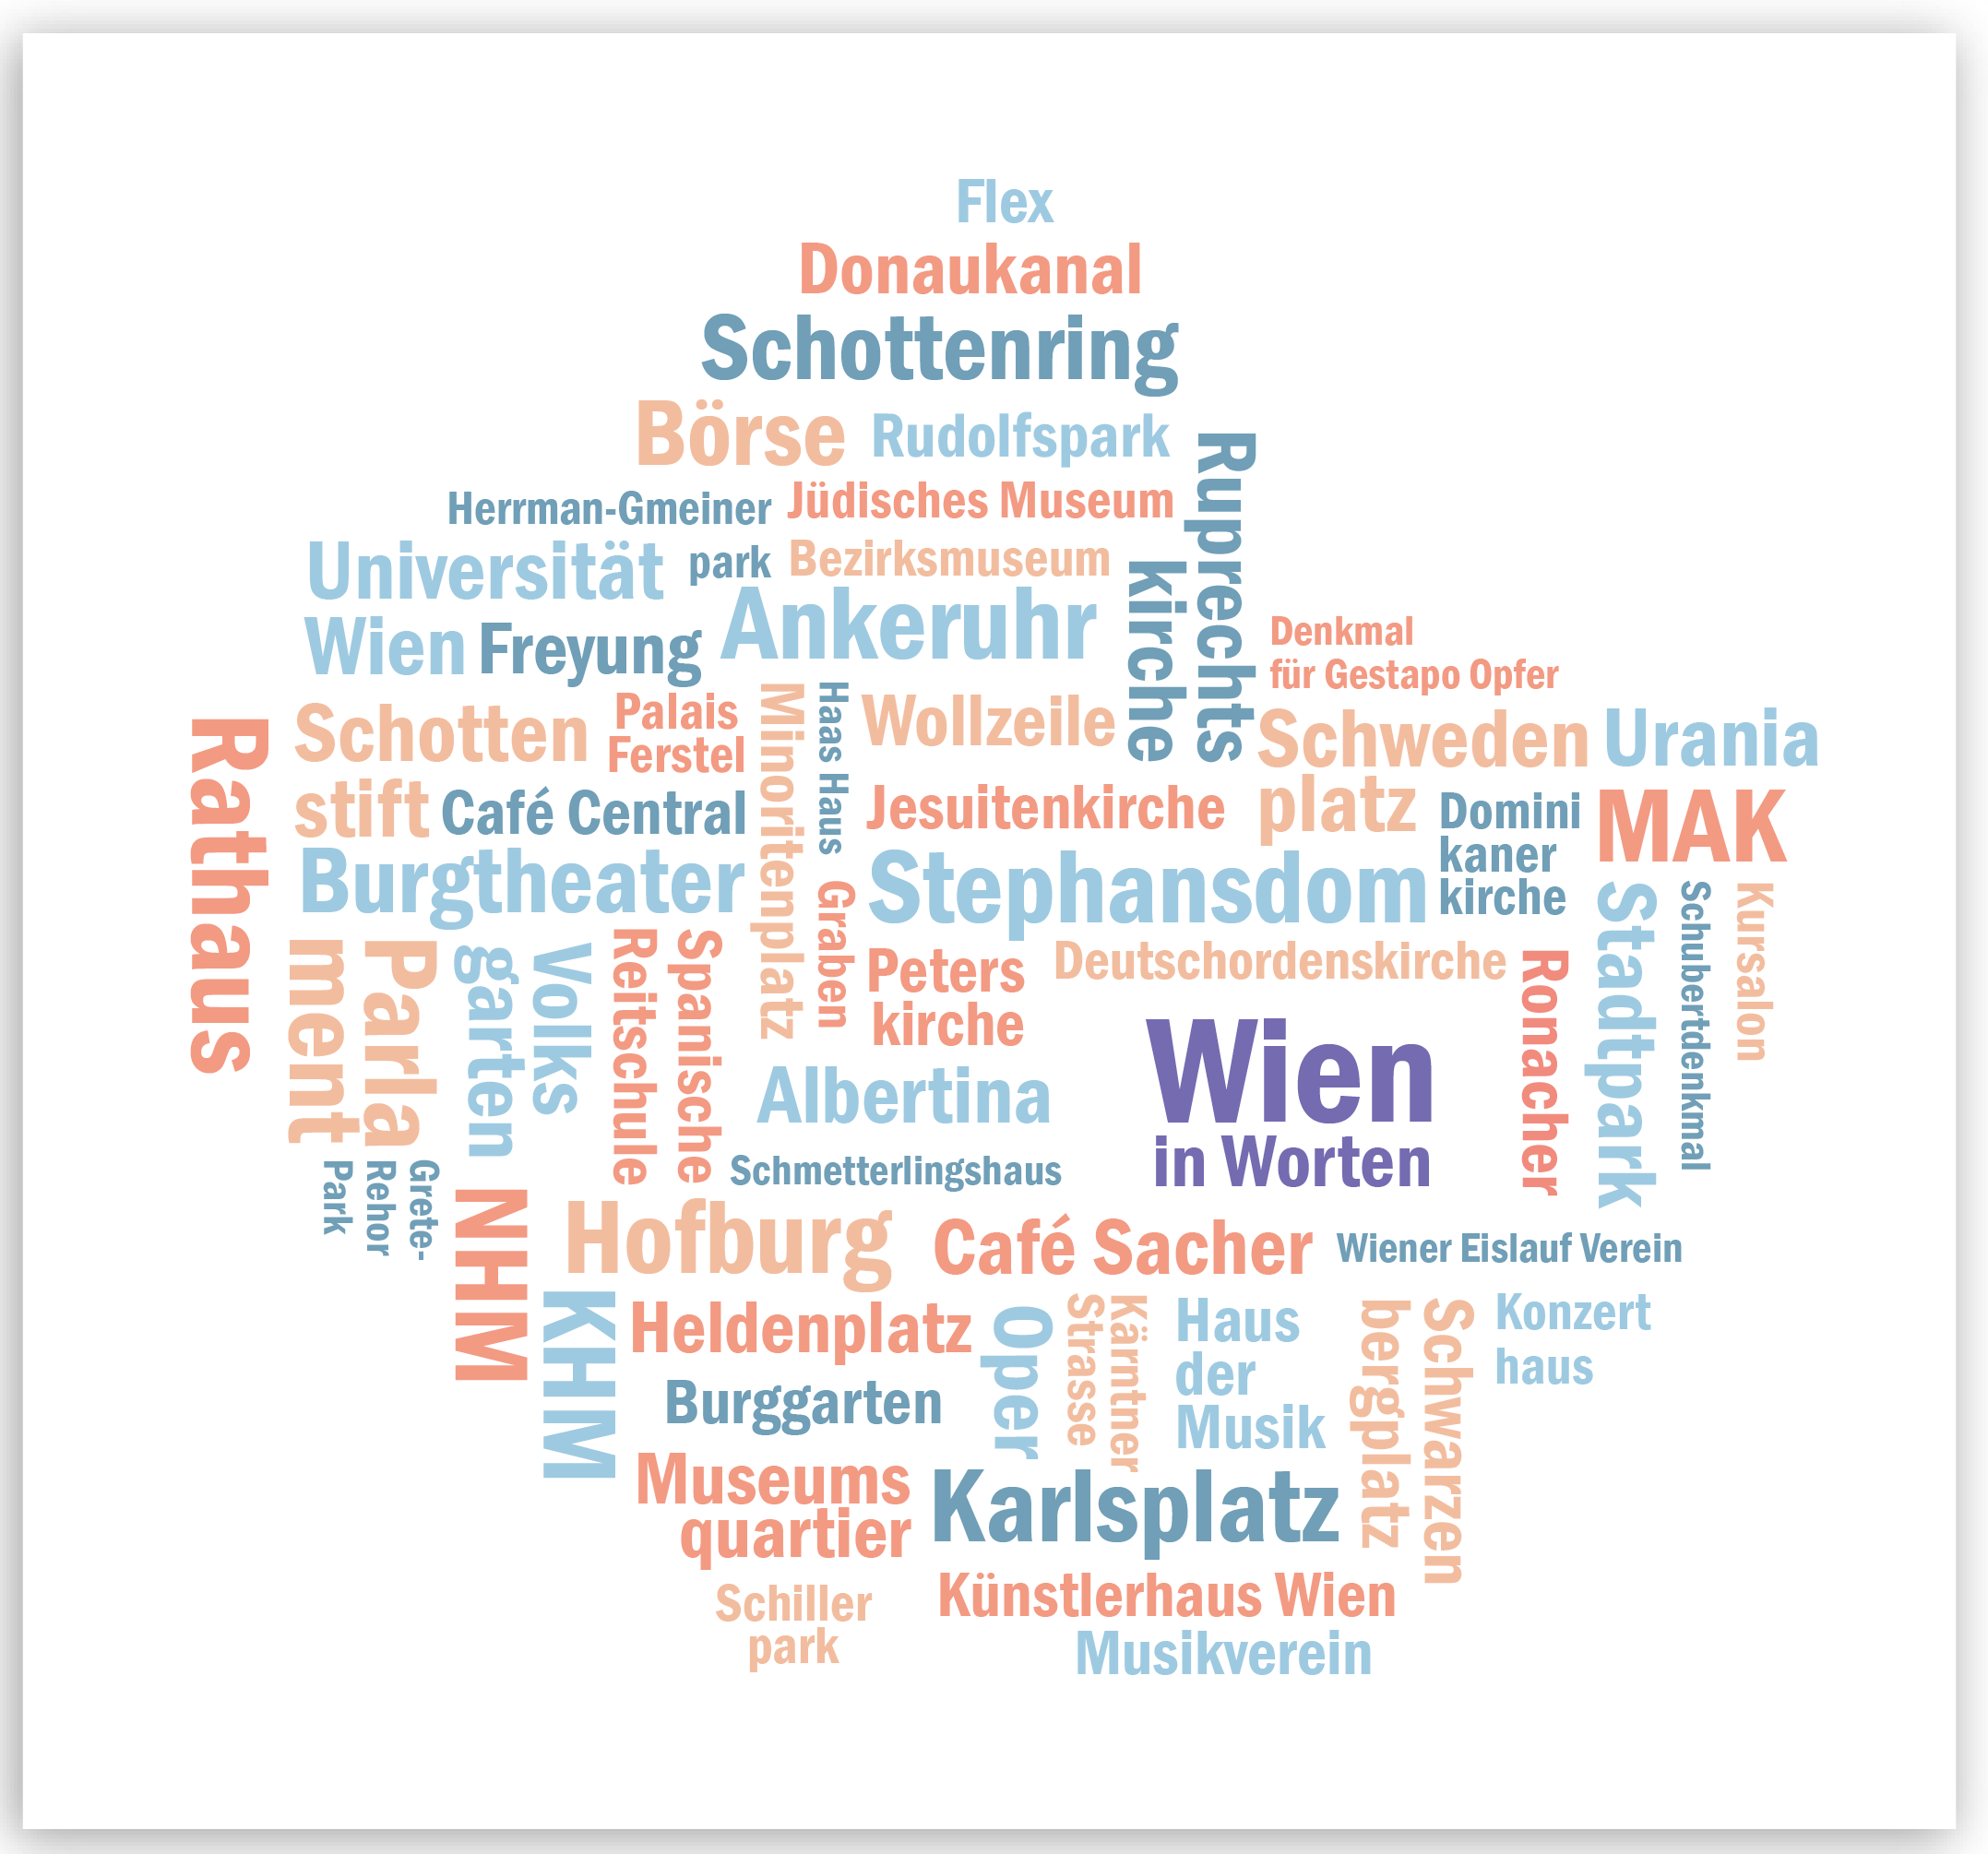
Vienna word map
This word map shows the names points of interest in Vienna (Austria) on their geographic location.
Tools: QGIS, Adobe Illustrator
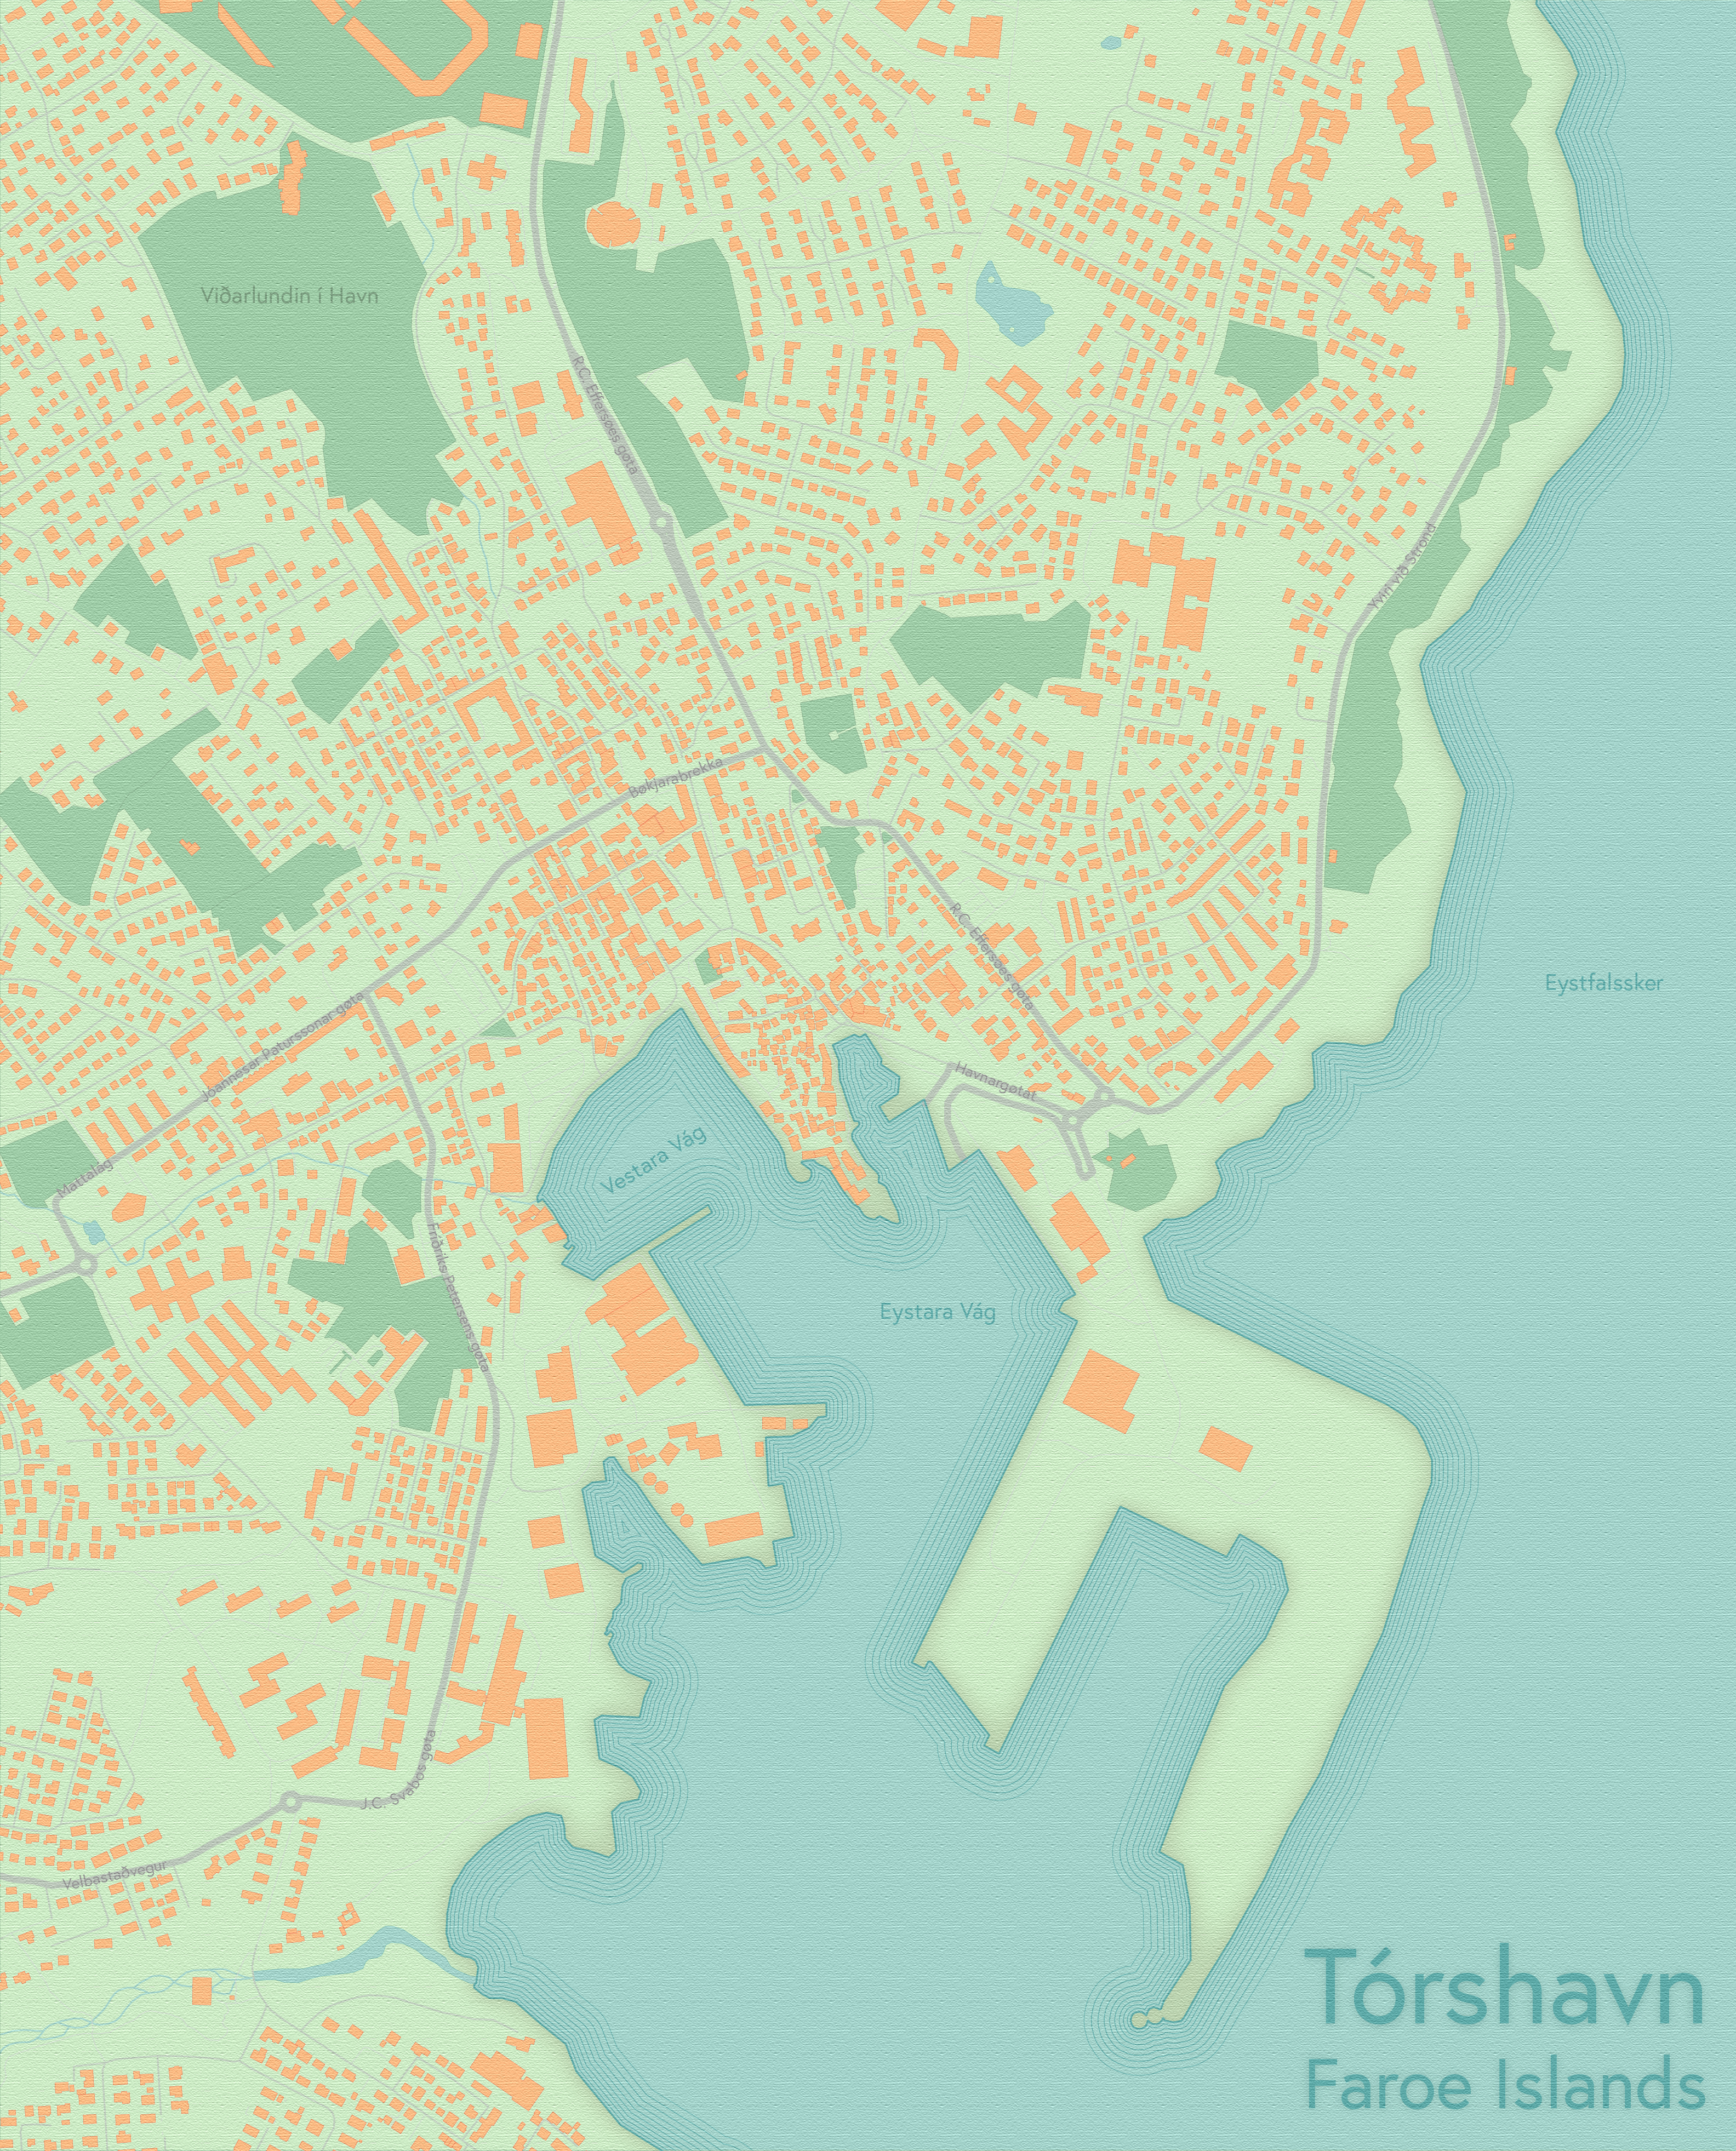
Faroe Islands
A post card design showing the wonderful city of Tórshavn on the Faroe Islands.
Click here to see original map
Tools: QGIS, Adobe Illustrator
Data source: Open Street Map – Geofabrik GmbH
Movement
This map was created as part of the #30DayMapChallenge 2021 (Topic: Movement). It shows my movement trajectory of the past months, tracked with my phone.
Click here to see original map
Tools: QGIS
Data source: see map
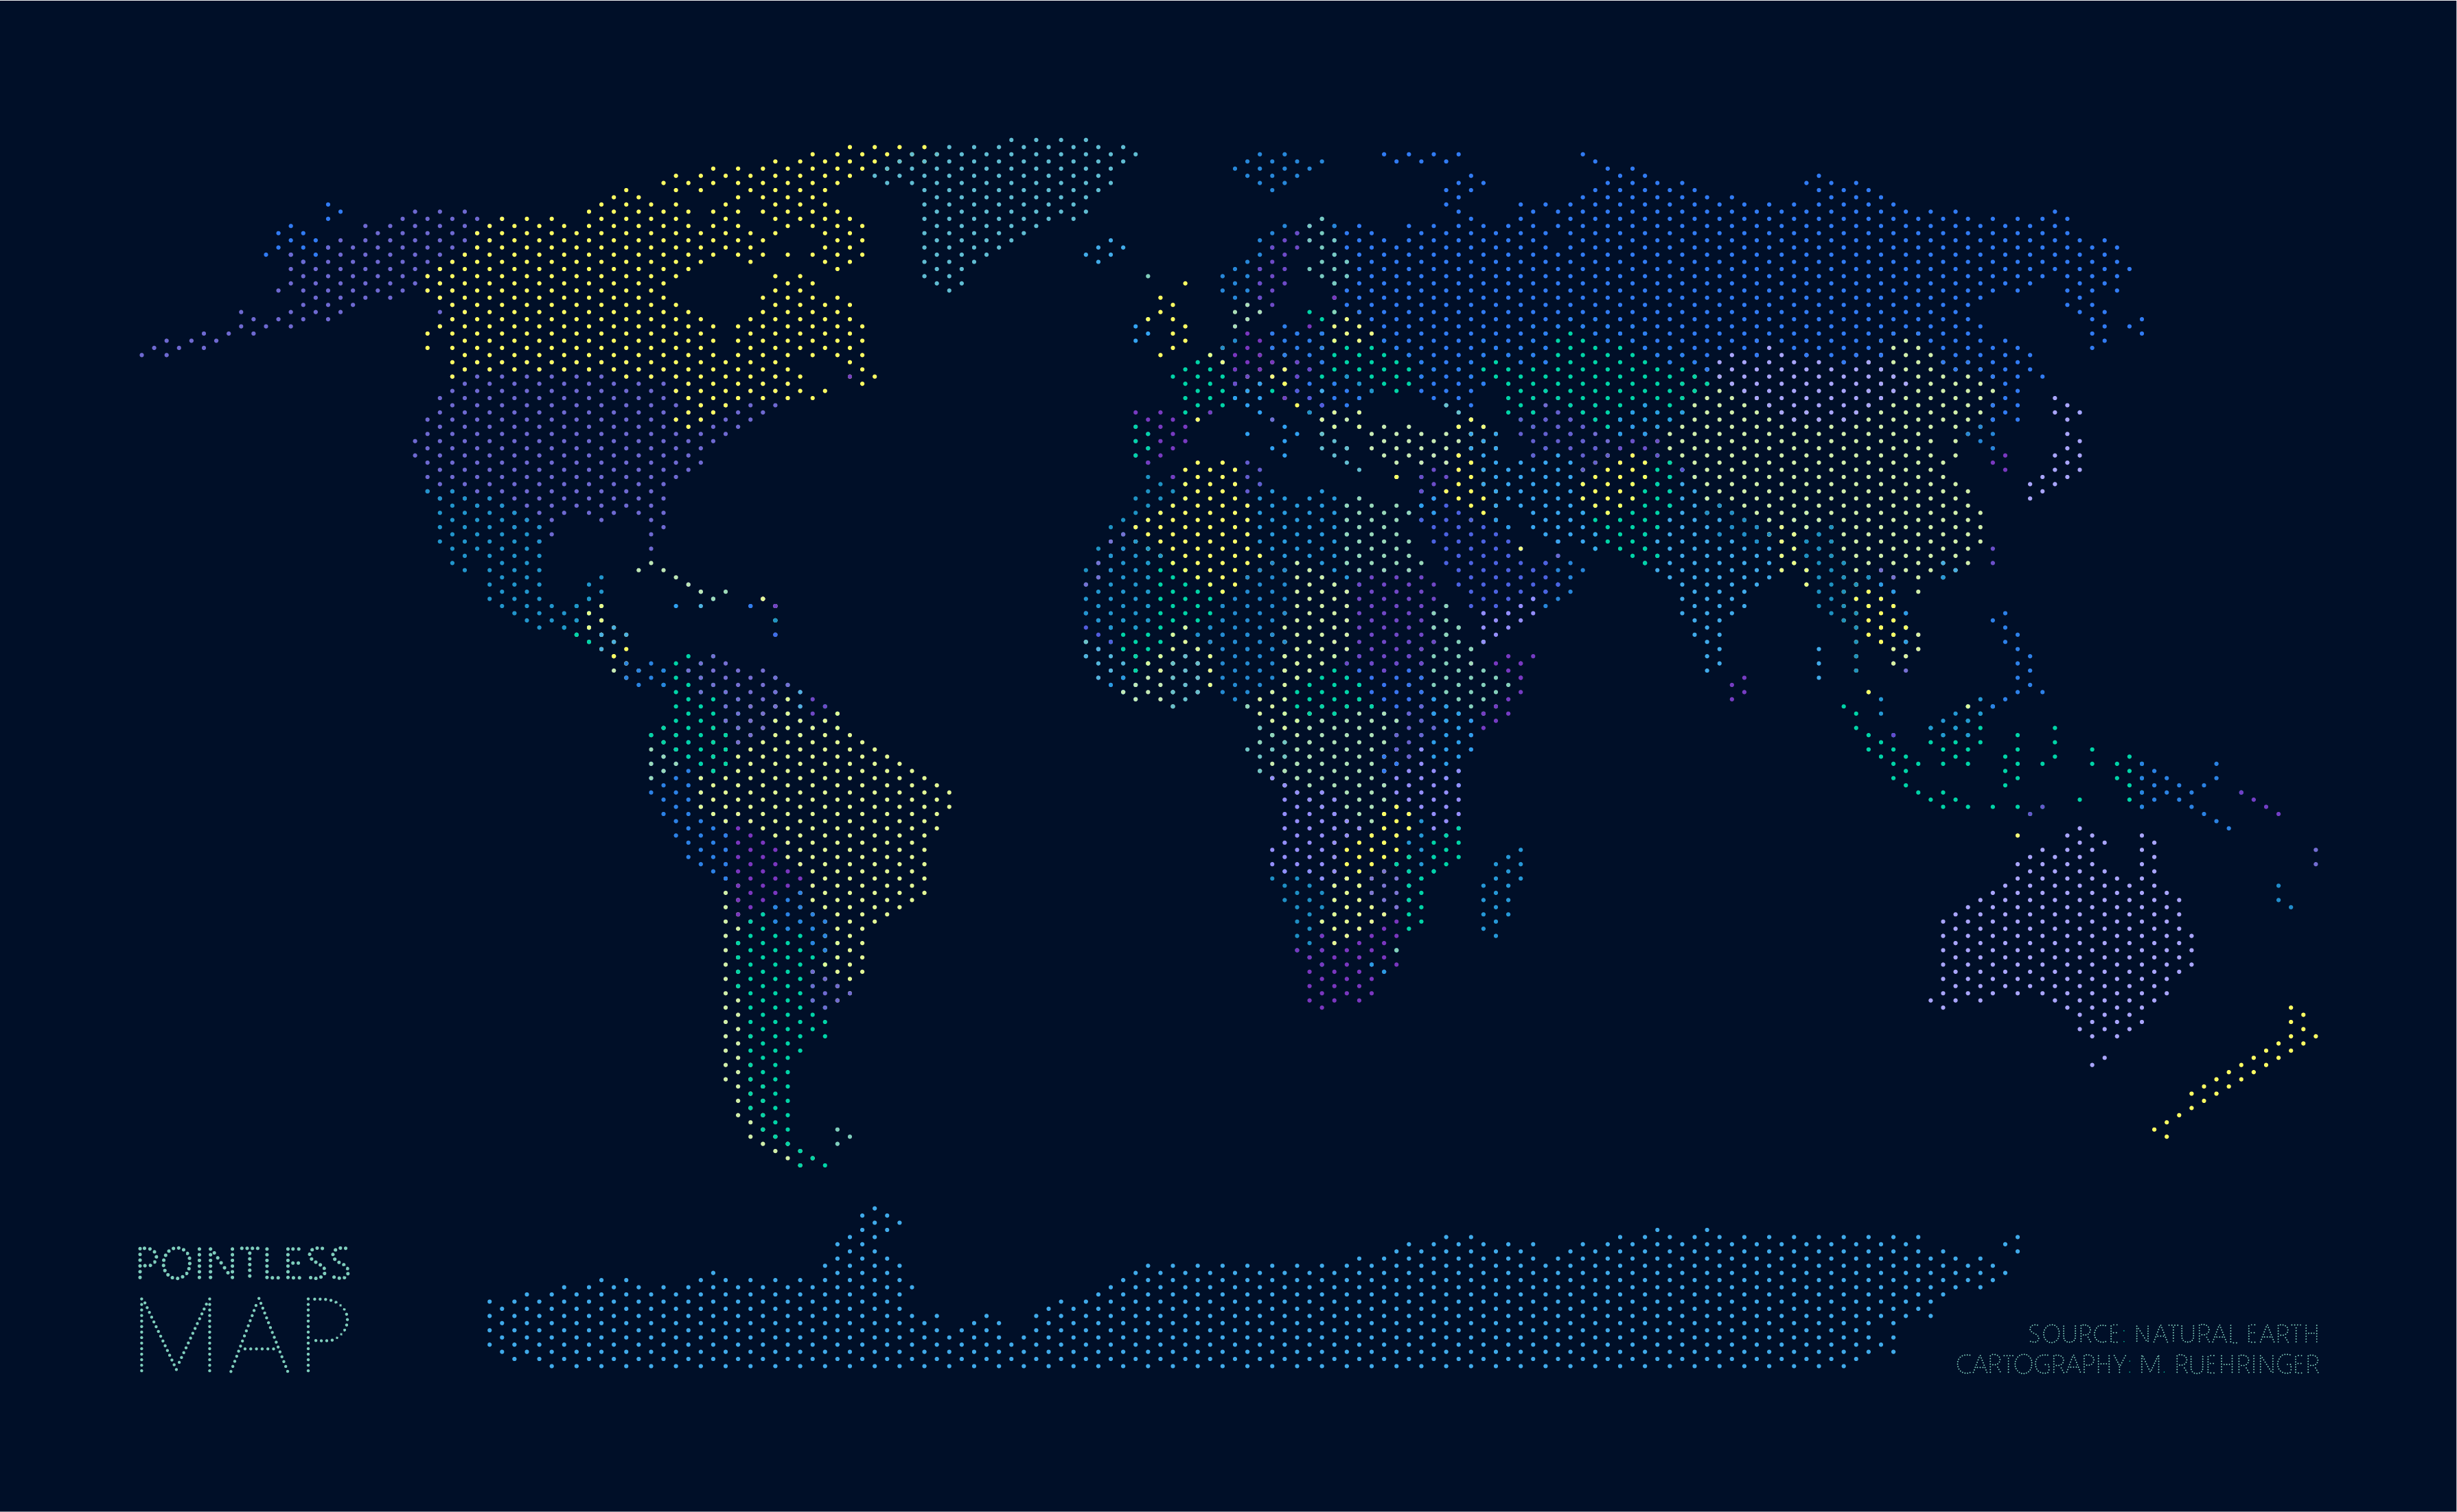
A pointless map
This map was created as part of the #30DayMapChallenge 2021 (Topic: Point). The points were created by creating a regular point grid.
Click here to see original map
Tools: QGIS, Adobe Illustrator
Data source: Open Street Map – Geofabrik GmbH (2019)

